
Performance Methodology - Data
zVPS Performance Data Infrastructure:
This section easily breaks down the performance data collected by zVPS, along with ways to solve issues where there is data missing from screens reports. Below is a picture of how data flows in zVPS.
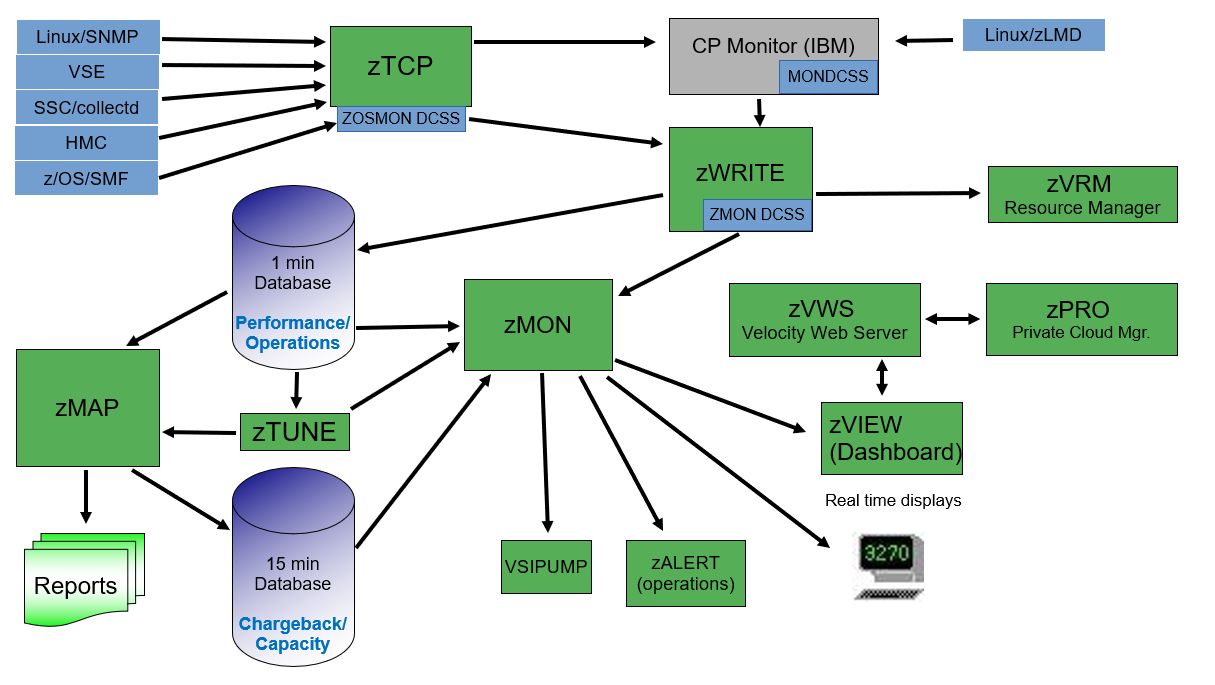
Important ZVPS System/Data Information:
- How Real Time Data Is Used/Stored
- Data used for realtime zVIEW/3270 screens, zALERT, zTUNE, and sending data to Grafana, etc.
- Real time data is gathered in 1 minute granularity on a minute boundary (this can be modified)
- Data resides in a DCSS then processed on ZWRITE and moved into files that reside on ZWRITE
- Files should close every 1 hour by default - can be modified to other time periods
- Files kept 1-3 days (should keep 3 days worth for problem determination - defined in LOCAL ESAWRITE file)
- To create a 1 minute increment zMAP report - use ESAMAP ft (REPORT_INTERVAL=60.
- How The Performance Database is Used/Stored
- Data used for reporting (daily reports), trending analysis, capacity, chargeback, etc.
- One minute data is processed on ZMAP at midnight and moved into files that reside on ZMAP
- Daily reports show data in 15 minute increments
- Files kept 90 days to x years (90 days is the default - can update in RUNAUTO PARMS file)
Data/Report Issues:
Occasionally, there may be the appearance that "zVIEW is down". This usually means there is data missing from screens or reports. Below are ways to check an the issue and resolve it.
- zVIEW or 3270 screens not working/missing data:
- Verify the MONITOR is up/active
- Verify ZWRITE is up and has sufficient space.
- Daily reports not being produced
- Verify that the ZMAP id is not logged on (autologged at midnight)
- Verify ZWRITE is producing data
- Verify ZMAP process didn't abend with insufficient storage - give more memory to ZMAP id, especially if running a large monthly report.
- Missing data from zVIEW or zMAP - DCSS issue (usually it is too small)
- The MONDCSS structure shows how data lines up - depending on what data is missing, it is easily seen where
the data cuts off if the DCSS is too small. It will need to be resized
- System data
- Scheduler data
- Scheduler data
- Memory (was Storage) data
- User data
- CPU data
- Disk data - this can also show as the DASD id and System id are the same in the DASD report
- If receiving a message - DCSS is full or Event Monitoring Suspended - the DCSS is too small, resize it
- If the monitor is stopping and starting every minute, the DCSS may be full, resize it
- Verify there are not multiple ZMON or MONDCSS DCSS's. This will cause stale data.
- Preventing DCSS too small issues:
- In ESAHDR, under "Monitor Segment Analysis" - look at the Sample and Event percentages
- If over 90% or climbing, resize the MONDCSS
- The ESASPARM COPY file on the ESAMON 191 disk can be updated to change the defined sizes
- If zVIEW is running slow - check MDC Resident on ESASTR1 - verify there is MDC space available
- No data or missing data from Linux -
- Verify ZTCP is up - on an authorized id, do SMSG ZTCP STATUS nodename and see if there is a response
- Verify ZTCP is getting enough cycles to run correctly - check ESAXACT
- Check ZTCP directory settings - verify IUCV ALLOW MSGLIMIT 2048 and IUCV ANY MSGLIMIT 2048 are set
- Verify SNMP is up and running correctly on the Linux server(s)
- Verify with the network group that there have been no firewall changes that would affect SNMP
- Verify the DNS is set up correctly
- Verify the correct MIBs are installed (ESALNXUP/ESALNXD) or SMSG ZTCP STATUS nodename
- No z/OS data - Verify ZOSMON is up on your z/OS system.
- For configuration data (required for MICS, may be requested from IBM), use SMSG ZSERVE SWCONFIG to restart the monitor. The monitor will restart on a minute boundary.
- Reports are too big - the following can be used to trim the data being reported by ZMAP:
- In the LOCAL ESAMAP file on the VMSYSVPS:ZVPS.CONFIG disk on ZVPS userid - add HSTSFT_THRESHOLD = 1; - this will reduce the the output by not keeping more granular information
- The ESAHST1 report can be removed by updating the ESAMAP51 ESAPRINT file (on the same disk)
- If a system is running high utilization (over 90%), the event data monitor overhead can be reduced by changing the MONITORSTART parm in the ESAPARM EXEC from 4 to 10. This will reduce monitor IUCV events by 30%.
Back to top of page
Back to Performance Tuning Guide
