
VSIPUMP - Visualizing Linux and z/VM data with Grafana
Visualization is everything. Looking at raw numbers doesn't always tell the whole story. We need an easy way to view the volumes of data that is produced by our performance tools.
Velocity Software provides zVIEW as a native platform tool to visualize the data that we produce from z/VM, Linux, VSE, and z/OS. zVIEW runs as an application in our z/VM based web server.
Introducing VSIPUMP. A tool that will take the data that we produce and send it to InfluxDB, Prometheus and/or OpenTelemetry Collector. Grafana can then access the data for visualization.
VSIPUMP is available to any customer that is licensed for zVPS.
A few highlights of VSIPUMP:
- Runs as a disconnected service machine
- Wakes up every minute to extract data from the performance monitor and reformats it into a form that is acceptable to the assigned collector(s)
- The destination of the data is easily indicated in the VSIPUMP configuration file
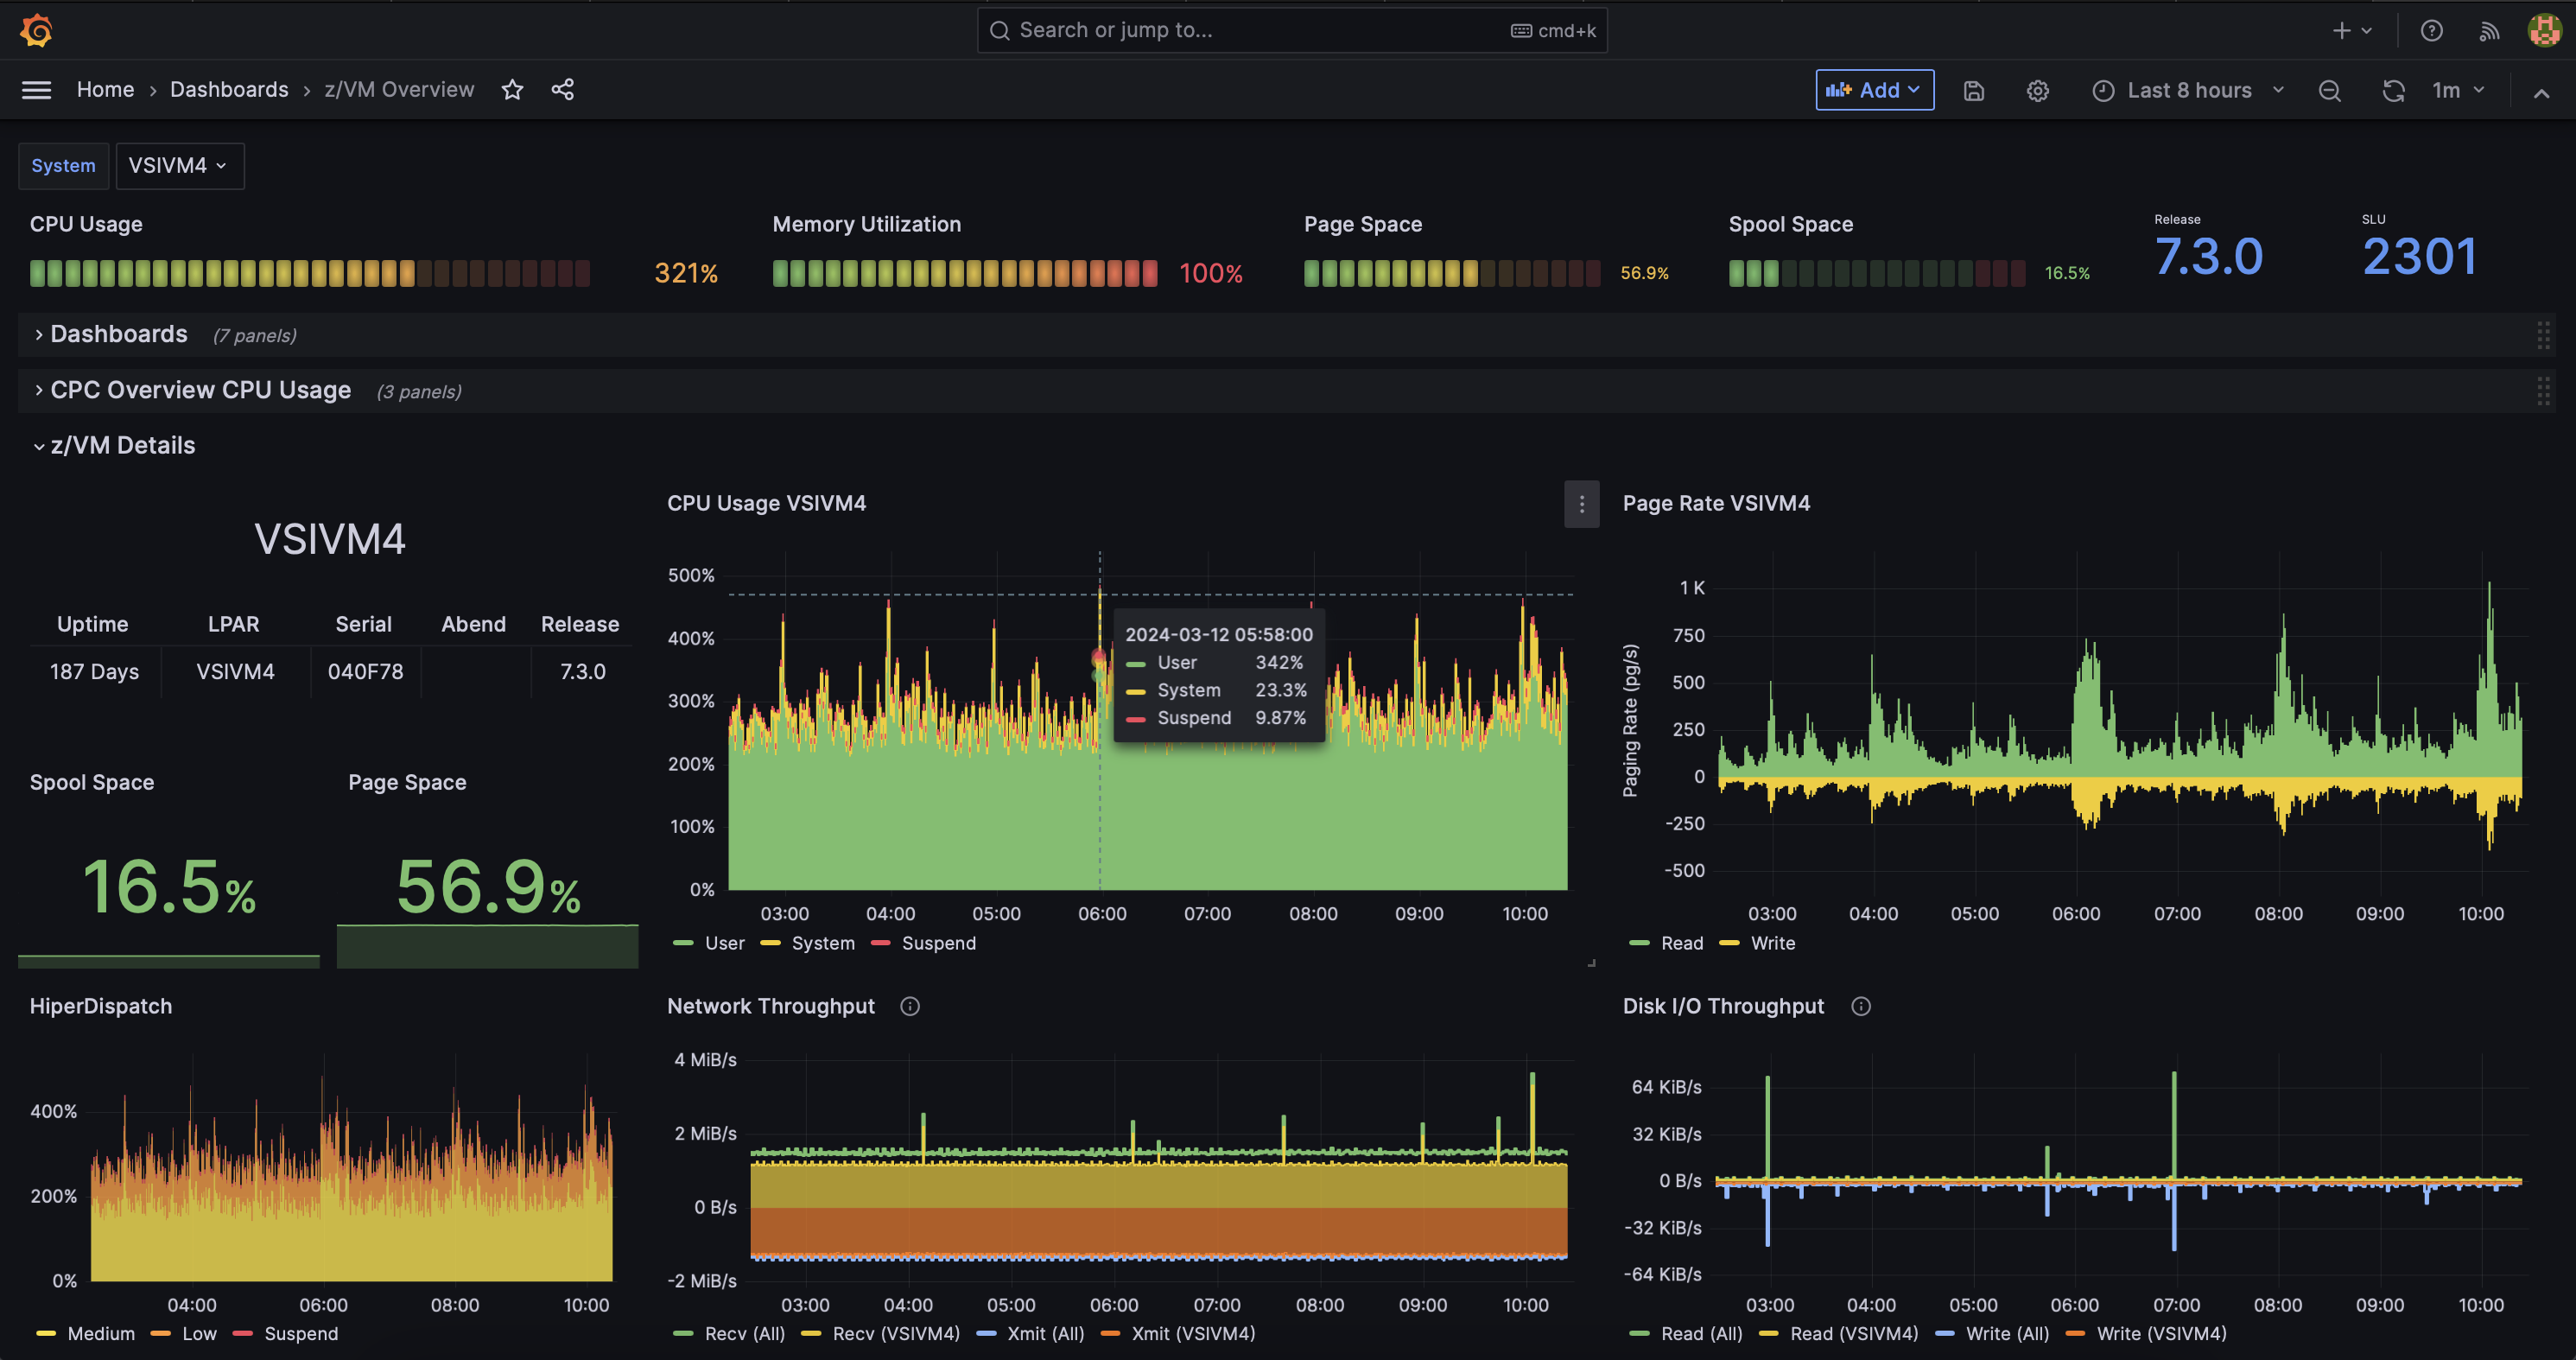
- Create your own dashboards or use the z/VM dashboards that are freely available on the Grafana web site
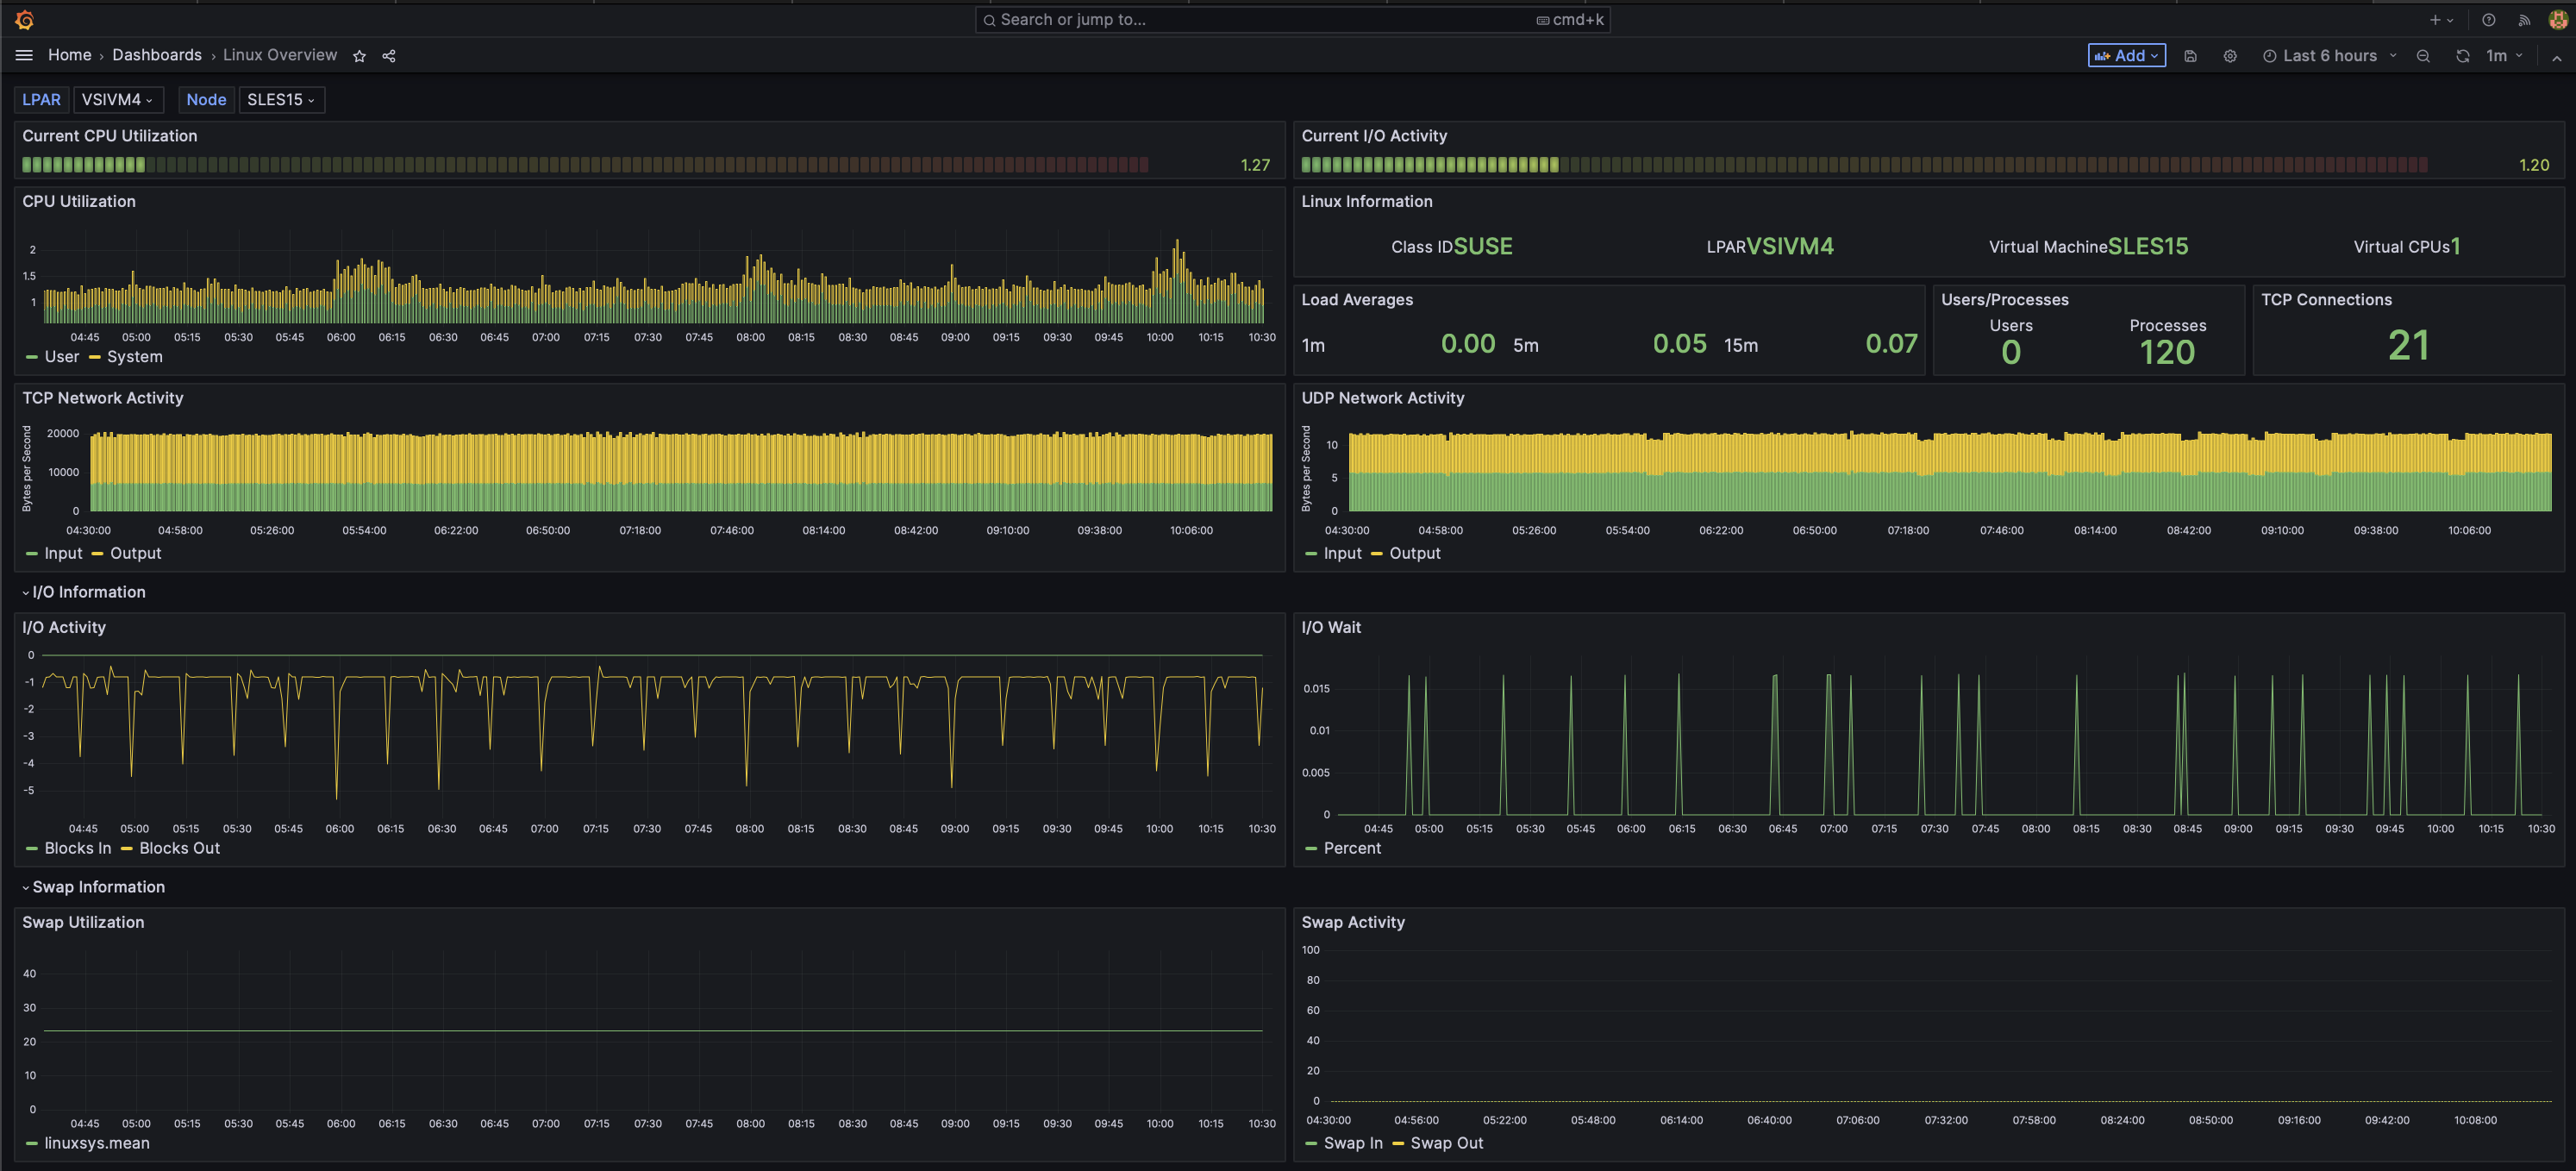
- Optionally provides additional data for Linux, Kubernetes, VSE, CICS, MongoDB and z/OS
Beneath these displays are the same screens shown live.
This data is LIVE and real time.
If these displays don't work, make sure http shows up in your location bar, not https.
