DASD Cache Analysis
Specifics - DASD Cache analysis:
Cache is used in the DASD control units to keep data in 'memory' until actually written to disk. Cache is a very effective
way for a DASD control unit to keep I/O moving quickly and efficiently. If cache is unavailable, each write has to be
done in the foreground instead of the background and the system performance can grind to a halt. Watch for:
- Cache fast write is active. It is very important for fast write to be active.
- The channel paths are online.
- The read cache hit ratio is low, more cache is needed.
- The write cache hit ratio is not 100, the write is being done to DASD, not cache.
- NVS is zero - if NVS (Non-Volatile Storage) is full, cache to no longer being utilized.
- Cache Inhibit/Bypass are zeros - if not, cache is not being utilized.
- Keep in mind that the data in the screens/reports are from all LPARS connected to the control units.
ESADSDC - Shows the current cache control unit configuration and characteristics.
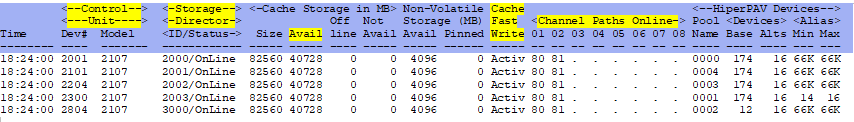
Control Unit - This shows the device number and model number.
Storage Director - This shows the storage director id and its status. Verify all are online.
Available Cache - This shows the available cache. It may be less than the total size if other LPARs are
also using that control unit.
Cache Fast Write - This shows that cache fast write is active. Active is good.
Channel Paths Online - This shows the channel paths online to each device. Verify each expected device is
online.
ESADSD5 - Shows the cache control unit performance.
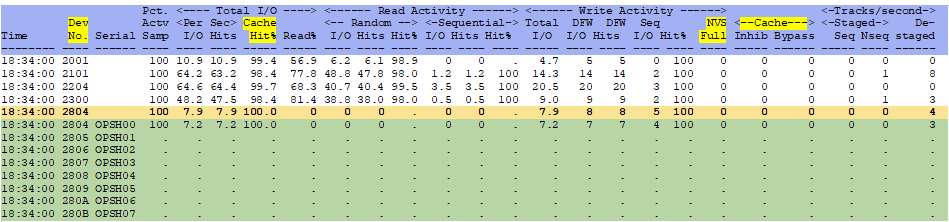
Device Number - This shows the device number and model number for the head of string.
Can click (zVIEW) or zoom (z/VM) to see the all of the devices on the string.
Total I/O Cache Hit% - This shows how well cache is being utilized. A low hit% (below 80) may indicate
more cache is needed or it might be batch (like backups).
NVS Full - This indicates the Non-Volatile Storage is full. This stops fast write (caching), which is a
big problem as it will cause the disks to be more highly utilized and slow down.
This is a good place for an alert.
Cache Inhib/Bypass - This also will indicate that caching is not working.
Note: The report groups together devices by control unit. This allows for comparison of the control unit
activity. Once a baseline for 'normal' performance is established, it is easy to determine if any control
units are utilized more than others. If this happens, volumes may need to be reorganized to better equalize controller
usage.
Back to top of page
Back to Flow Chart main page

