DASD Subsystem Analysis
DASD Analysis
Planning considerations:
- Do NOT combine spool, paging, TDISK and minidisks at the volume level to avoid contention and overhead.
- Do NOT have multiple page or spool allocations on the same volume.
- Do NOT put TDISK on the same volume as other data that has a performance requirement.
- Use dedicated volumes for SFS File Pools.
- Use dedicated volumes for Linux shared disks and Linux LVM (Logical Volume Manager).
- Do NOT share z/OS and z/VM data at the control unit level to avoid error recovery complications and performance
issues if z/OS runs I/O intensive batch jobs.
When to use HyperPAV:
Parallel Access Volumes or HyperPAV/HPAV is using multiple devices or aliases to address a single ECKD disk device).
HyperPAV is meant to reduce I/O wait.
This can be helpful when the asynchronous I/O wait (shown in ESAXACT) or device utilization (shown in ESADSD2)
is greater than 20%. Or if there is queue time (also shown on ESADSD2).
To verify HyperPAV is working, check that queuing has been reduced/eliminated. To verify HyperPAV is worth the expense,
check the SSCH/sec avg vs the HiperPAV rate SSCH (on ESADSD2) - the higher percentage, the better it is working.
For performance data for HPAV, see the following reports:
- ESADSD1 - Shows HPAV configuration information
- ESADSD2 - Shows operations per second.
- ESADSDC - Shows HPAV device configuration for the control unit
- ESAHPP - Shows HPAV device pool analysis
- ESAPSDV - Shows HPAV I/O rate
- ESALNXF - Shows msI/O for reads and writes and response time/queue times - check the numbers before and after
installing HPAV to help show if the change has been beneficial
Linux Planning:
- For some Linux volumes and z/VM paging volumes, the I/Os are larger and longer in duration. Plan for Linux volumes and
page volumes to have service times at 1-2ms per I/O, thus a device should be targeted at 50-100 I/Os per second. Traditional
I/Os at 4K per I/O have service times in the 1-2 ms range, which means 50 I/Os per volume is a reasonable target.
- SCSI is currently not suited for high access data or paging due to reduced performance.
- For control units in a Linux environment, the issue is often the non-volatile write cache as Linux will buffer writes
and then write out data in large bursts overflowing the write cache. Ensure there is a mechanism for detecting NVS full
conditions. Minimizing Linux server memory sizes also minimizes the potential of this problem by reducing the available
memory to cache write data.
When is DASD an Issue:
- When there is paging, there could be a DASD or cache issue.
- When there is contention for a disk.
- When there are high I/O workloads that exceed the hardware limits.
DASD Issues/Solutions:
- Queue time: on channel, control unit, device -
Solution(s): HPAV (2nd path to a device) reduces queue time
- Device time: pend time (SAP or I/O protocol time), connect time (channel transmission time) or disk time -
Solution(s): The new z17 architecture moves the channel controller closer to the chip,
faster channels and or more/better cache.
For a presentation about the DASD environment and utilization, see
DASD Performance
Helpful ESAMON screens/ESAMAP reports:
- ESADSD1 - DASD configuration - shows how the current DASD is configured.
- ESADSD2 - DASD performance analysis Part 1 - shows how the current DASD is performing.
- ESADSD6 - DASD performance analysis Part 2 - shows different information about DASD performance.
- ESADSDC - Cache control unit configuration - shows how the current DASD cache is configured.
- ESADSD5 - Cache (3990) analysis - shows cache activity and effectiveness.
- ESACHAN - Channel performance analysis - shows how the current DASD channels are performing.
- ESASEEK - DASD seeks analysis - shows the DASD arm movement per volume.
- ESAUSEK - User minidisk seek analysis - shows each user's minidisk activity.
- ESAXACT - Transaction delay analysis - shows an analysis of virtual machine states and wait states.
ESADSD1 - Shows the current DASD configuration and characteristics.
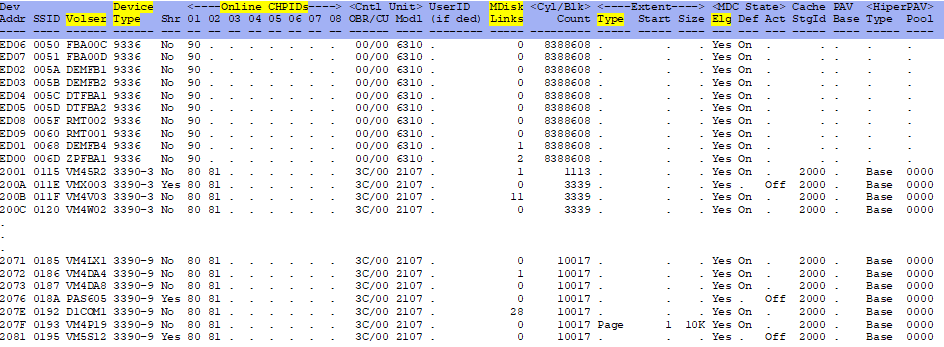
Volser - This is the volser name. Often the name indicates what kind of data is on the device.
IE - VM4P19 is a paging device on system VM4.
Device Type - This shows the DASD device type - ie a 3390-3 is a "Mod 3" device with 3339 cylinders.
Online CHPIDs - Shows what CHPIDs are associated with each device. Depending on the device type, there should
be at least two CHPIDs per device.
Some device types are ok to have one CHPID or can architecturally only handle one
CHPID. Verify the expected number of CHPIDs are present/online.
UserID (if ded) - This shows if a device is dedicated. If it is dedicated and the device is over 50% busy,
it would be good to evaluate defining it as a minidisk so it will utilize MDC (minidisk caching).
MDisk links - This shows how many minidisks are currently on each device. Certain devices like paging or
spooling, should not have minidisks defined.
Extent Type - If the device is a page/spool device, it will show it here. This is good to verify that page
and spool devices aren't being shared with minidisks.
MDC Elg - Indicates if this device is eligible for minidisk caching. MDC needs to be enabled for certain
processes. Enabled is appropriate, however it is irrelevant for paging devices.
ESADSD2 - Shows DASD performance.
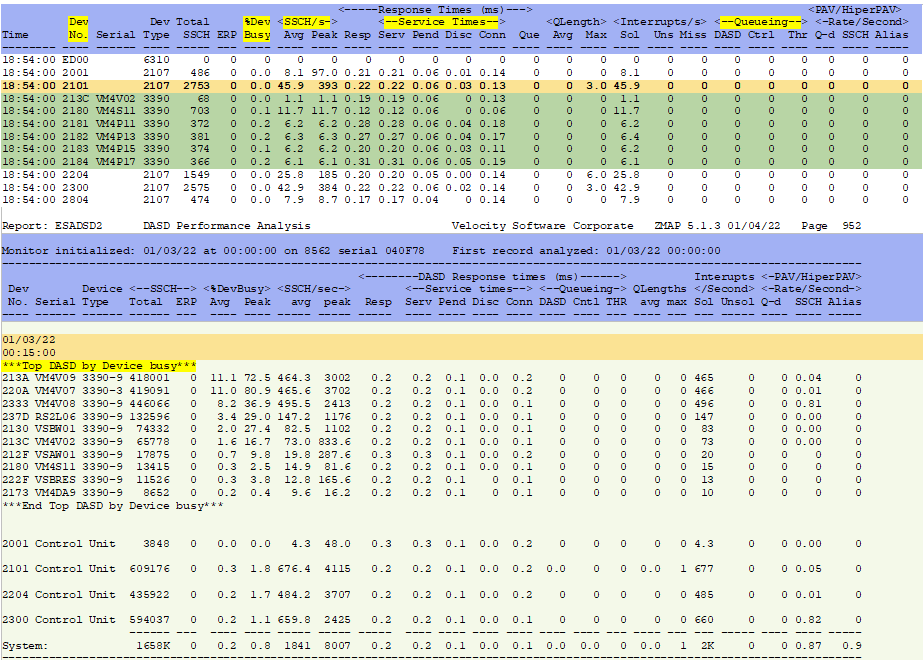
Device Number - This shows the device number and model number for the head of string.
Can click (zVIEW) or zoom (z/VM) to see the all of the devices on the string.
This will first show all the devices that have activity.
%Device Busy - This shows the elapsed time a device was busy (if not seeing the whole string, the head of string
will show the total for that string). If devices are shared between systems, device busy will go up.
Look for out of pattern busy numbers which can show a disk that is overworked or
may be failing. The ESADSD2 report will show the top DASD by Device busy.
If the device busy is over 50, there is very high utilization and will probably also show queuing. The exception for
this is if doing backups.
SSCH Average/Peak - This shows the amount of start subchannel commands were issued per second on average and
the peak. This indicates which DASD are the most busy.
Response Times - This shows different aspects of how the devices are functioning.
When Response times do not equal Service times, there is queueing.
High Response/Service times can show a dysfunctional/overworked device,
that HyperPAV is turned off/not working or there is a need for secondary channels.
Service times of 2.4 are high by today's standards.
High Pending/Disconnect times can be an indication of a cache problem.
High Disconnect times can be also indicate the need for solid state DASD. A number over
10 is high.
High Connect time may indicate faster channels are required or there are very large
block data transfers.
Queueing - This shows the different ways a device can queue. It shows where the queuing is happening -
in the device vs the control unit vs I/O throttling
(where multiple entities are after the same data). Queueing over 10 is high - evaluate
the controller details. HyperPAV can usually help in this area.
Note: The report groups together devices by control unit. This allows for comparison of the control unit
activity. Once a baseline for 'normal' performance is established, it is easy to determine if any control
units are utilized more than others. If this happens, volumes may need to be reorganized to better equalize controller
usage.
ESADSD6 - DASD performance analysis Part 2 - shows different information about DASD performance
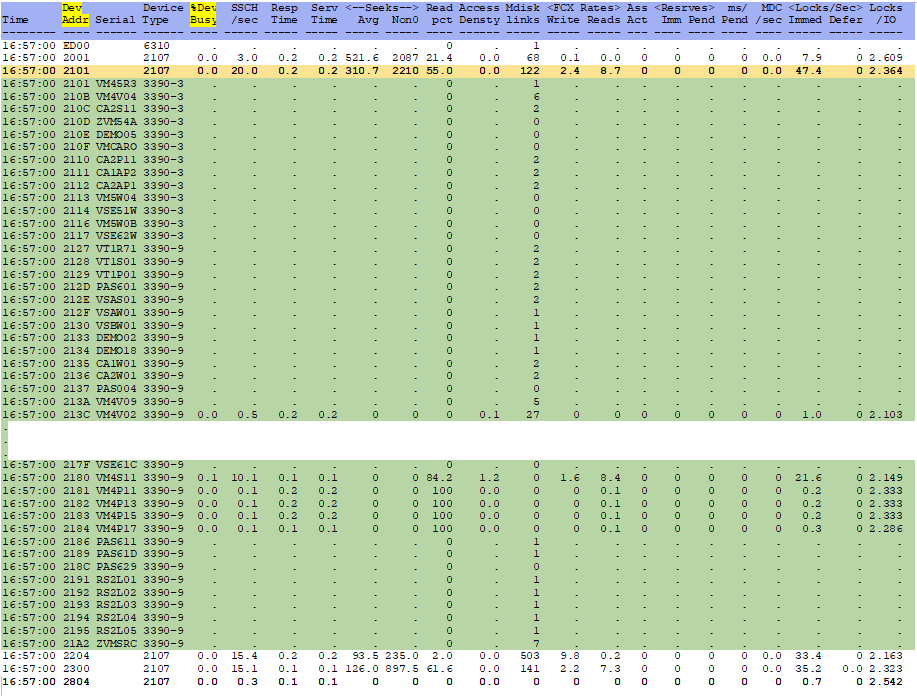
Device Addr - This shows the device number and model number for the head of string.
Can click (zVIEW) or zoom (z/VM) to see the all of the devices on the string.
%Device Busy - This shows the elapsed time a device was busy (if not seeing the whole string, the head of string
will show the total for that string).
Look for out of pattern busy numbers which can show a disk that is overworked or
may be failing. If the device busy is over 50, there is very high utilization.
ESADSDC - Shows the current cache control unit configuration and characteristics
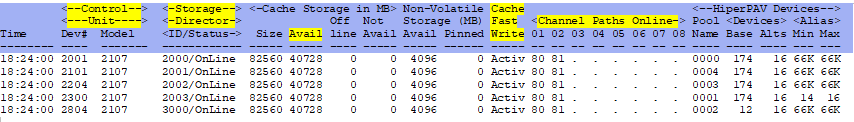
Control Unit - This shows the device number and model number.
Storage Director - This shows the storage director id and its status. Verify all are online.
Available Cache - This shows the available cache. It may be less than the total size if other LPARs are
also using that control unit.
Cache Fast Write - This shows that cache fast write is active. Active is good.
Channel Paths Online - This shows the channel paths online to each device. Verify each expected device is
online.
ESADSD5 - Shows the cache control unit performance
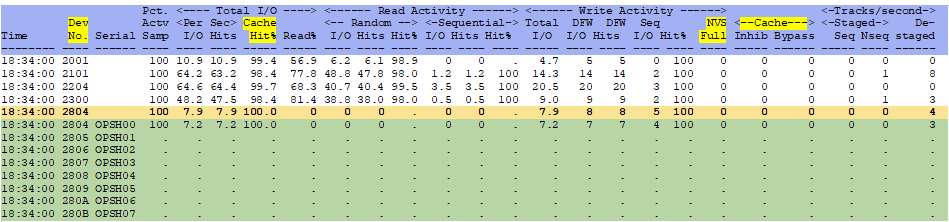
Device Number - This shows the device number and model number for the head of string.
Can click (zVIEW) or zoom (z/VM) to see the all of the devices on the string.
Total I/O Cache Hit% - This shows how well cache is being utilized. A low hit% (below 80) may indicate
more cache is needed or it might be batch (like backups).
NVS Full - This indicates the Non-Volatile Storage is full. This stops fast write (caching), which is a
big problem as it will cause the disks to be more highly utilized and slow down.
Cache Inhib/Bypass - This also will indicate that caching is not working.
ESACHAN - Shows the channel performance
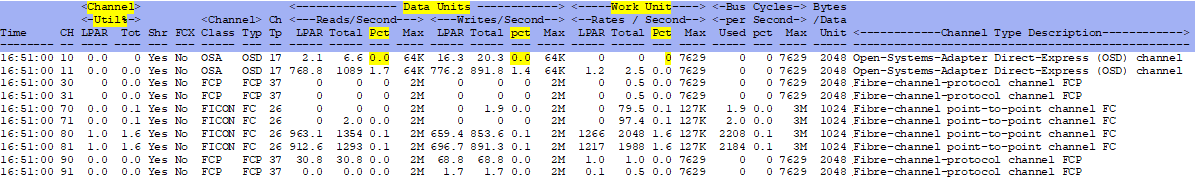
Channel Util% - This shows the channel utilization for the LPAR and all the LPARS to which it is connected. If
the LPAR utilization is over (50%-ESCON or 40%-FICON), consider faster channels or moving data.
If the total utilization for all of the connected LPARS is over (50%-ESCON or 40%-FICON)
consider adding channels, moving to faster channels or moving data to other channels.
Data Unit/Work Unit/Bus Cycles Pct - This shows the percent busy for the channel. This should
really stay under 40%.
ESASEEK - Shows the DASD arm movement per volume
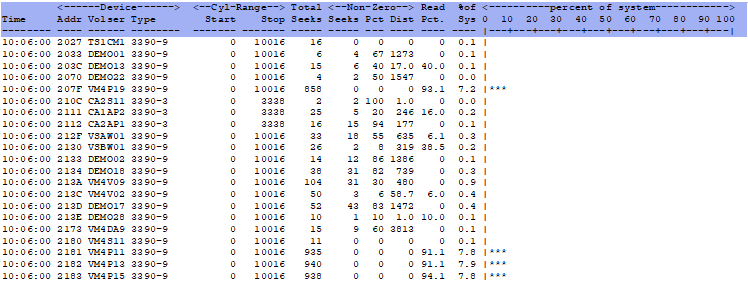
Device address/volser/type - This shows DASD that is active. Seeks are no longer a good way of showing
performance, however this information can be helpful when looking for where servers are using data
(if data needs to be moved, a device needs to be taken offline, etc).
ESAUSEK - Shows the DASD activity by minidisk
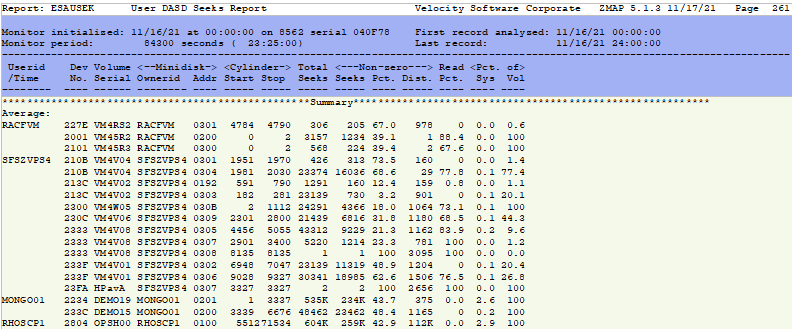
Volume/Minidisk Ownerid - This shows the volume and owner of the minidisk. Like ESAUSEEK, seeks are no
longer a good way of showing performance,
however this information can be helpful when looking for where
servers are using data (if data needs to be moved, a device needs to be taken offline, etc).
ESAXACT - Transaction delay analysis. This can show if users are waiting on I/O operations.
Helpful DASD information:
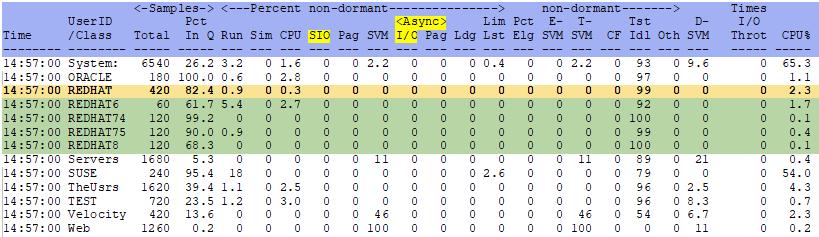
UserID/Class - This shows the userid/class.
SIO - This shows if a user is waiting for input/output operation start.
Async I/O - This shows if a user is waiting with asynchronous input/output operation outstanding.
Can click (zVIEW) or zoom (z/VM) to see the all of the users in a class.
Conclusions
It is very important that users/servers can get to their data. If there are DASD/cache/channel issues, this can cause
major performance issues. Servers using the same disks/volumes can cause contention which will also cause performance
problems.
Back to top of page
Back to Performance Tuning Guide

