DASD Utilization Analysis
Specifics - DASD Utilization analysis:
Calculations:
DASD response time = service time + queue time
DASD service time = pend time + disconnect + connect - should be in the 1ms range
Device busy = rate * service time
DASD response time = (service time) / (1 - device busy)
Hardware Solutions:
DASD response time, queue time or device busy is/are high - HyperPAV would be helpful
DASD disconnect time high - go to solid state DASD (pend and connect stay the same) or
add more cache
DASD connect time high - go to faster channels (z17 will also drop it)
DASD Pend time high - Look at the I/O Processor - ESAIOP
DASD service time high - do one or more of the above
Helpful ESAMON screens/ESAMAP reports:
- ESADSD2 - DASD performance analysis Part 1 - shows how the current DASD is performing.
- ESADSD6 - DASD performance analysis Part 2 - shows different information about DASD performance.
ESADSD2 - Shows DASD performance. Both screen and report samples:
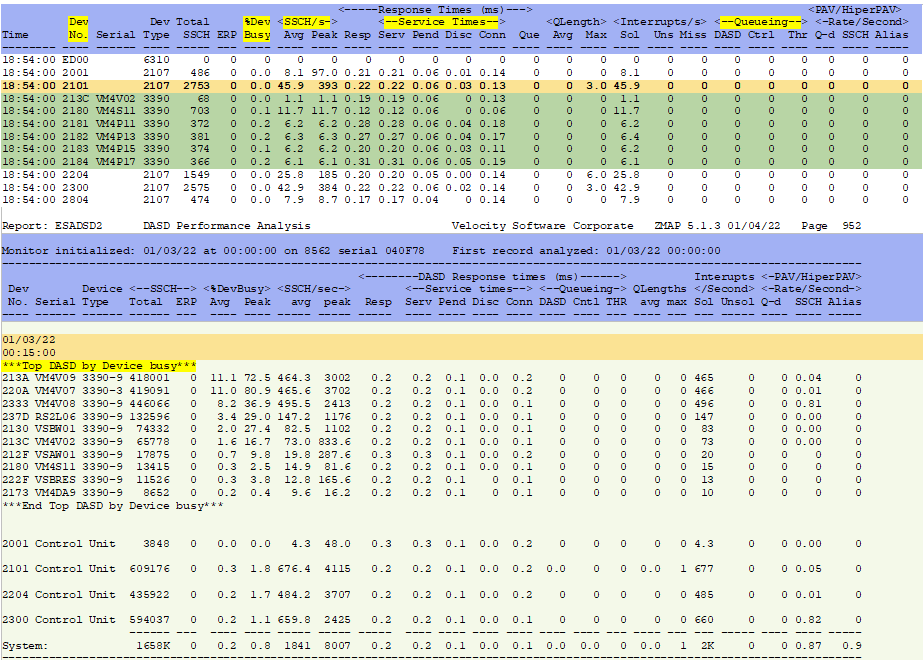
Device Number - This shows the device number and model number for the head of string.
Can click (zVIEW) or zoom (z/VM) to see the all of the devices on the string.
This will first show all the devices that have activity.
%Device Busy - This shows the elapsed time a device was busy (if not seeing the whole string, the head of string
will show the total for that string). If devices are shared between systems, device busy will go up.
Look for out of pattern busy numbers which can show a disk that is overworked or
may be failing. The ESADSD2 report will show the top DASD by Device busy.
If the device busy is over 50, there is very high utilization and will probably also show queuing. The exception for
this is if doing backups. HyperPAV is another good solution to high device busy.
SSCH Average/Peak - This shows the amount of start subchannel commands were issued per second on average and
the peak. This indicates which DASD are the most busy.
Peak shows the 1 minute peak for the device. The report will show this for 15 minute
intervals over the course of a day to do trending/determine problem times.
Response Times - This shows different aspects of how the devices are functioning.
When Response times do not equal Service times, there is queueing (queue time should be zero).
High Response/Service times can show a dysfunctional/overworked device,
that PAV/HiperPAV is turned off/not working or there is a need for secondary channels.
Service times of 2.4 are high by today's standards.
High Pending/Disconnect times can be an indication of a cache problem.
High Disconnect times can be also indicate the need for solid state DASD.
High Connect time may indicate faster channels are required or there are very large
block data transfers.
Queueing - This shows the different ways a device can queue. It shows where the queuing is happening -
in the device vs the control unit vs I/O throttling (where multiple entities are after the same data). Queueing
over 10 is high - evaluate the controller details. HyperPAV is another good solution to queue time.
Note: The report groups together devices by control unit. This allows for comparison of the control unit
activity. Once a baseline for 'normal' performance is established, it is easy to determine if any control
units are utilized more than others. If this happens, volumes may need to be reorganized to better equalize controller
usage.
ESADSD6 - DASD performance analysis Part 2 - shows different information about DASD performance. Both screen and
report samples:
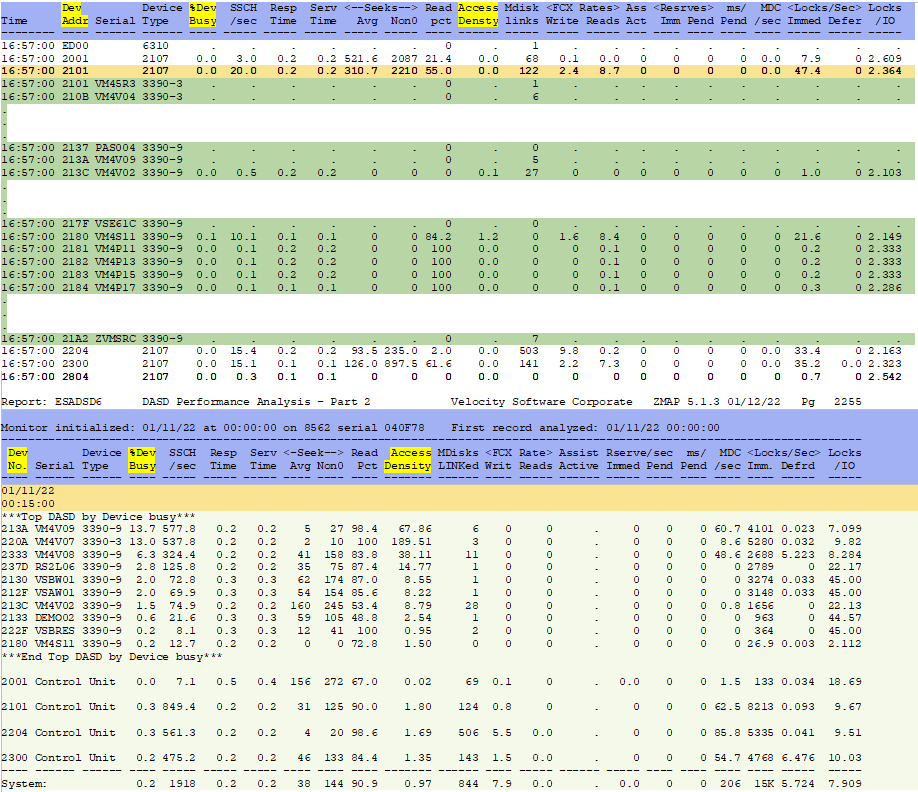
Device Addr - This shows the device number and model number for the head of string.
Can click (zVIEW) or zoom (z/VM) to see the all of the devices on the string.
%Device Busy - This shows the elapsed time a device was busy (if not seeing the whole string, the head of string
will show the total for that string).
If the device busy is over 50, there is very high utilization.
Look for out of pattern busy numbers which can show a disk that is overworked or
may be failing. The ESADSD6 report will show the top DASD by Device busy.
Access Density - This shows the number of I/O operations per gigabyte of capacity. Look for numbers above that
may be above that threshold.
Back to top of page
Back to Flow Chart main page

