Data Rate Analysis
Specifics - Network data rate analysis:
Network errors can often show where a network slowdown is occurring (or has occurred). Another major issue in the
network environment is an overload of data coming into an interface. Knowing the common approximate amounts of data
transmitted per server helps identify when it is much higher than expected. Using the ESATCP1/ESATCP2/ESATCP4 reports,
high data transmission times can be seen (possible overruns/issues) and trended (determining 'prime times').
ESATCP4 - Shows TCPIP interface information from the hardware layer and errors from the ICMP and hardware layers.
Both the screen and report samples:
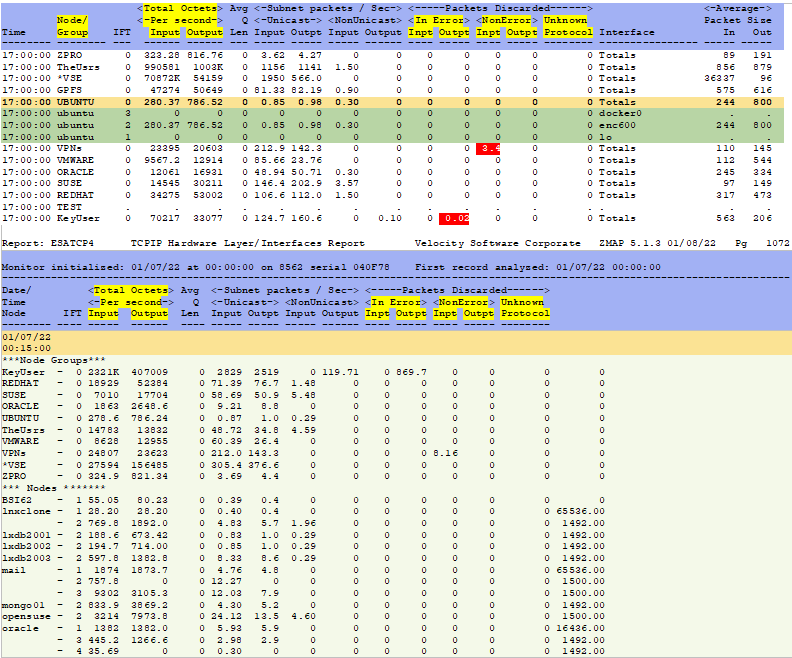
Node/Group - This is the zTCP node or group name. Can click (zview) or zoom (z/VM) to see the all the nodes in
a group.
Total Octets per second Input/Output - This shows the rate of transmission at this level. It is good to be
familiar with the typical rate to be able to recognize when this rate
goes up beyond expectations, which could signify a problem or a network overrun.
If the total octets per second - input number goes over 500,000, that it excessive.
Packets Discarded - This shows how many packets have been discarded due to errors, a reason other than an error,
and for having an unknown protocol. Investigate consistent or a significant number of errors.
See below for examples of how to watch one node for a period of time.
Example 1 - Watch a node for a time period on zVIEW:
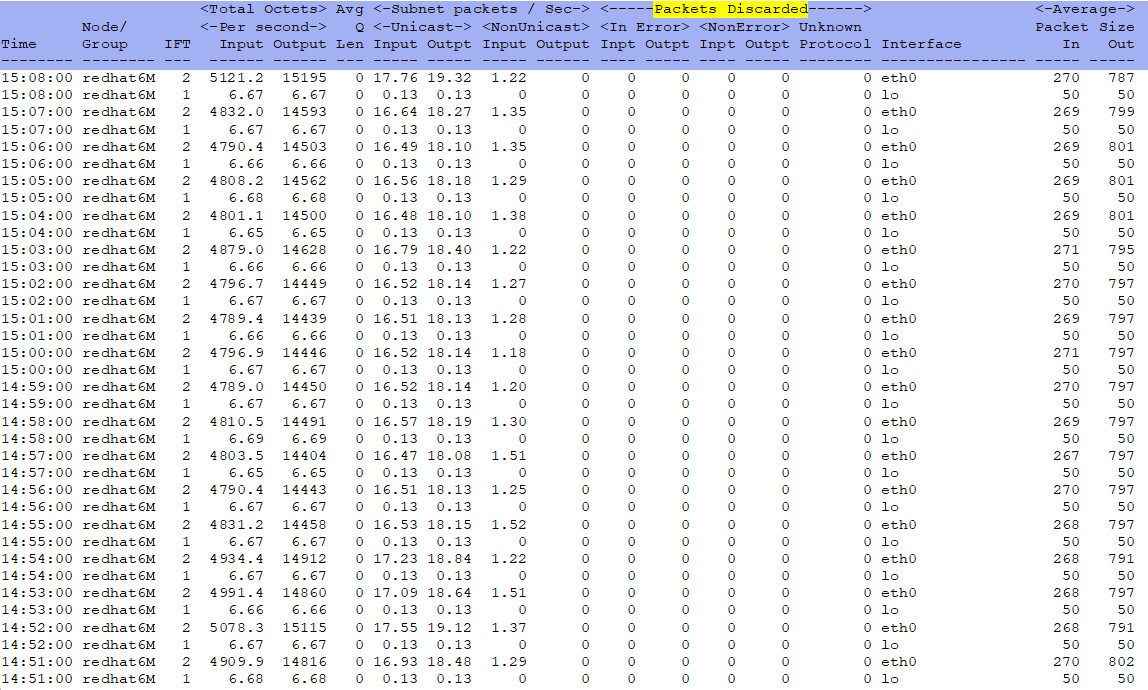
On zVIEW, go to the ESATCP4 screen.
Click on the pencil in the upper right corner.
Update the parameters needed - this used a start time of 14:50, end time 15:07, user class of REDHAT and a node name
of redhat6M. Track consistent or numerous errors.
Click Build URL button.
Click Submit.
Example 2 - Watch a node for a time period on z/VM:
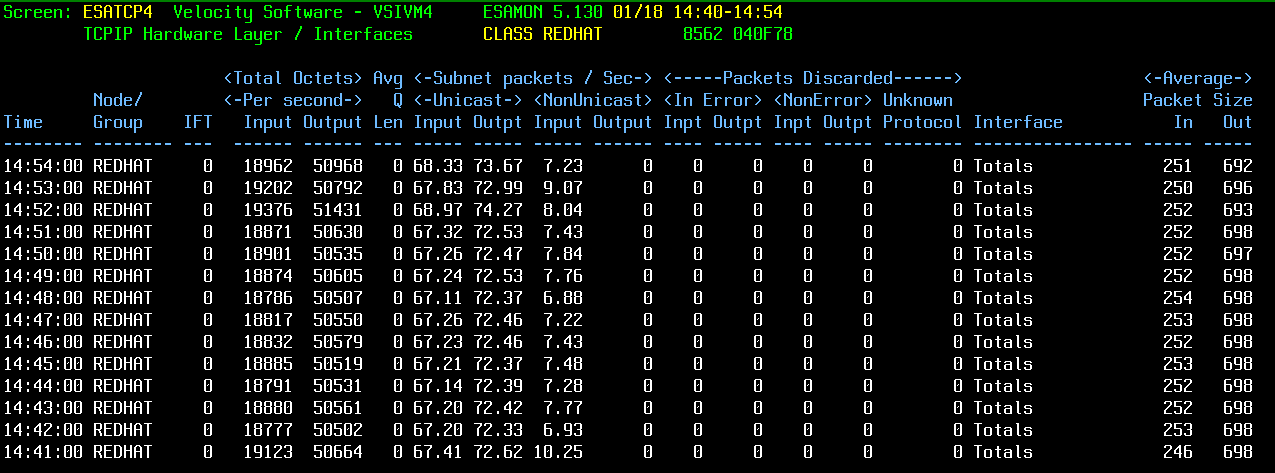
Issue ESAMON ESATCP4 from an eligible user.
Update the time parm in the top right hand corner to a time period. This example used 14:40-14:54.
Update the class parm under time to a class. This example used redhat. If the node is known, can use that as well.
Hit enter.
Track consistent or numerous errors.
Back to top of page
Back to Flow Chart main page

