Linux Network Analysis
Linux Network - Best Practices
Helpful ESAMON screens/ESAMAP reports:
- ESALNXUP - Linux Node Status - Shows the status of Linux nodes monitored by zTCP.
- ESALNXD - Linux Node List - Shows the mapping between the Node name defined to zTCP, the Network Address defined
to zTCP and the Host Name returned by SNMP.
- ESATCPI - TCPIP Interface Screen - Shows the Internet Control Message Protocol (ICMP) and hardware interface data.
- ESATCP2/4 - TCPIP Layer information - Shows different TCPIP layer information.
Using zVPS to find information for solving issues with the Linux network:
ESALNXUP - Shows the configuration information for the processes being monitored.
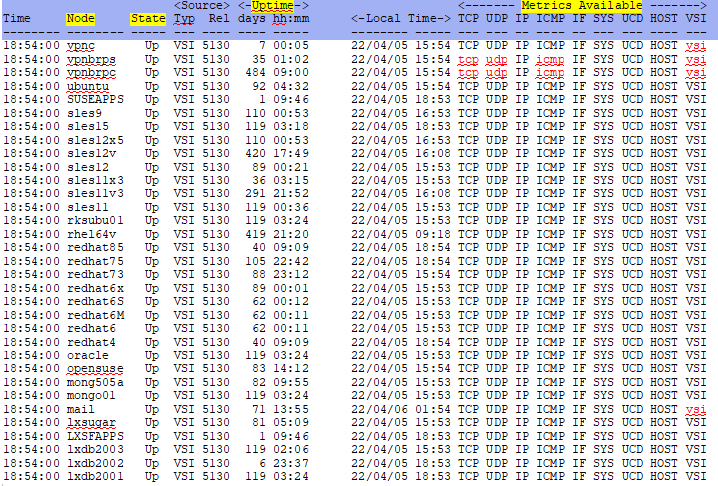
Node - This shows zTCP node name. This is usually the server name.
State - This shows the status of the node. It is easy to see if a node is up or down. If it is only partly
responding, it will show as +/-.
Alerts can be created if a node goes down or isn't responding 100%.
Uptime - This shows the amount of time since the last Linux reboot in days/hours/minutes.
Metrics available - This shows what individual MIB groups are available. If the MIB group is in lower case and
red, it is not available.
Note: Intel/Microsoft servers and VPNs will not allow the VSI MIB.
Note: Clicking on a Node line (zVIEW) or zoom (z/VM) will show the ESATCPC configuration information for that node.
ESALNXD - Shows the configuration information for the processes being monitored. This is helpful general information.
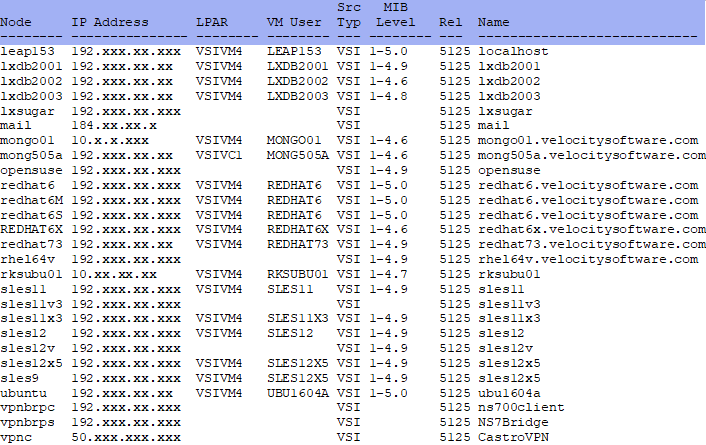
Node - This shows zTCP node name. This is usually the server name.
IP Address - This shows the IP address defined in the zTCP node definition.
LPAR - This shows the LPAR the server is running on.
VM User - This shows the VM user id of the server.
Src Typ - This shows the SNMP agent - either VSI for Velocity Software Net-SNMP or HST for the standard
Net-SNMP.
MIB Level - This shows the release level of the Velocity Software MIB.
Rel - This shows the release level of ZTCP.
Name - This shows the system name for the server.
ESATCPI - Shows TCPIP interface information from the ICMP layer.
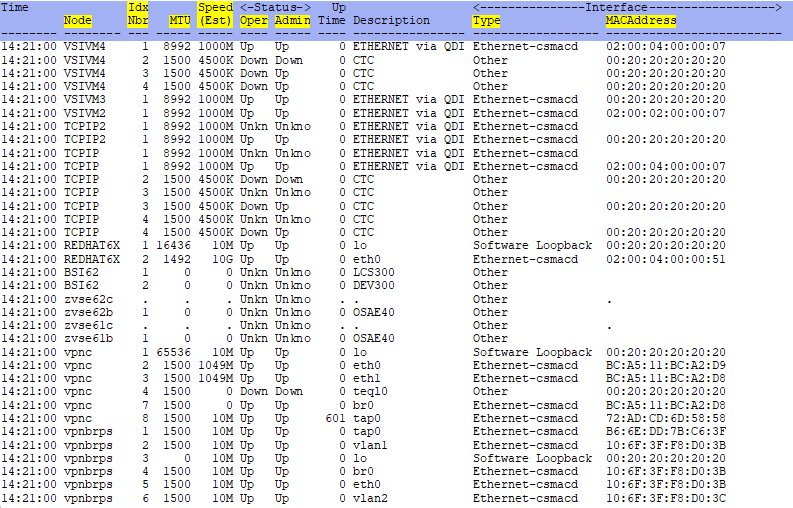
Node/Idx Nbr - This is the zTCP node name and index number if there are multiple nodes.
MTU - This shows the Maximum Transmission Unit for that node. MTU size should be above 1501.
Speed - This shows the estimated speed of the interface.
Status - This shows the status of the interface from both an operational and an administrative point of view.
Type/MACAddress - This shows the type of interface and the MAC address. Notice some MAC addresses are
virtual.
ESATCP2 - Shows TCPIP internetwork Layer Data from the IP protocol.
Helpful network information:
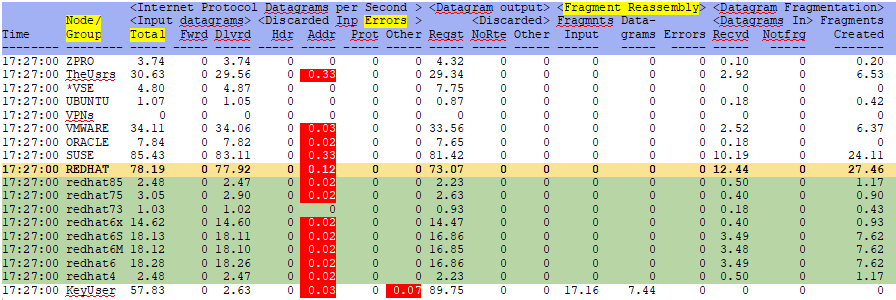
Node/Group - This is the zTCP node or group name. Can click (zVIEW) or zoom (z/VM) to see the all the nodes in
a group.
Input datagrams Total - This shows the total number of input datagrams received from interfaces.
Discarded Input Errors - This shows the number of datagrams discarded because of errors. It can be seen here
the fields that have a number other than 0 are highlighted.
Watching for and alerting on errors can catch problems more expeditiously.
Fragment Reassembly - This shows the number of datagrams that were fragmented. Fragmentation happens when the
maximum datagram sizes are too small. This causes overhead
in both fragmenting and reassembling the data.
ESATCP4 - Shows TCPIP interface information from the hardware layer and errors from the ICMP and hardware layers.
Helpful network information:
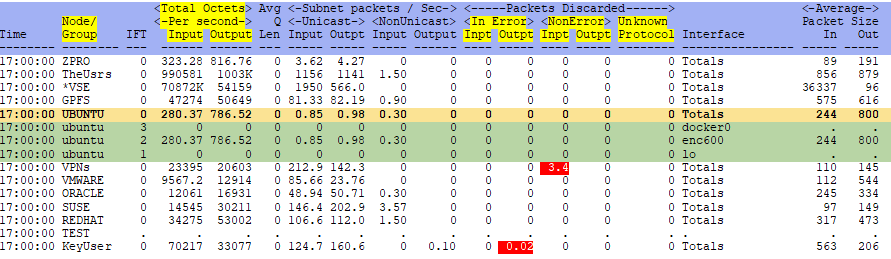
Node/Group - This is the zTCP node or group name. Can click (zVIEW) or zoom (z/VM) to see the all the nodes in
a group.
Total Octets per second Input/Output - This shows the rate of transmission at this level. It is good to be
familiar with the typical rate to be able to recognize when this rate
goes up beyond expectations, which could signify a problem or a network overrun.
If the total octets per second - input number goes over 500,000, that it excessive.
Packets Discarded - This shows how many packets have been discarded due to errors, a reason other than an error,
and for having an unknown protocol. Investigate consistent or a significant number of errors.
Conclusions
Back to top of page
Back to Performance Tuning Guide

