
Linux Memory Analysis
Linux Memory - Best Practices
Presentation on Linux memory (also called storage) - Linux Storage Measurement and Tuning
Helpful Memory Settings/Information:
- Memory Issues:
- Linux was designed for dedicated memory, which is very expensive.
- Linux is LRU (Least Recently Used) which competes with VM's memory reference pattern.
- When a Linux server logs on, it has a lot of initialization pages that won't be touched again. z/VM still has to back them up.
- Linux tends to have timer pops that cause a large amount of data to be cached and then not referenced.
- Spin locks can occur when memory that has a lock is paged out and another server is waiting, both having a large amount of memory in general. This can cause the system to start paging excessively.
- Memory Solutions:
- Linux guest size - Do not define more memory than needed. Decrease the size of the machine until swapping occurs.
An example would be: Instead of 128M for a guest machine, define 24M and 100m swap. - If running Oracle (especially), defining HUGE pages is a benefit. Pages are by default 4K. HUGE pages are larger, usually 1M, 2M or 1G.
- Linux swapping -
- Use VDISK for swap (if using real disks, move to paging disks).
- Virtual disks can be shared across virtual machines.
- Start with 1 small VDISK (100M) and 1 larger VDISK (2G). Set the priority to favor the smaller VDISK.
- Do not format the disks.
- Set an alert if the larger VDISK is used.
- Note: In Linux the lower number has the higher prioritization and will be used first.
- Use $ swapon -s to verify the sizes of the two disks.
- Check /etc/fstab to determine the priority of the two disks - the smaller should be set to pri=1.
- Unused VDISK is paged out (goodness).
- The cost of the swap daemon on Linux is about 10% but z/VM swapping to VDISK is very fast and low cost.
- Use DIAG driver instead of FBA. FBA is 512 bytes. DIAG will group those into 4K pages which reduces I/O by a factor of 8.
- Adjust the minidisk caching memory to SET MDC STORAGE 128M 128M
- Set MDC OFF for minidisks being used for Linux file systems and swap disks to avoid redundant levels of caching.
- Set the swappiness setting in Linux to zero. Use $ cat /proc/sys/vm/swappiness to check the value.
- Other Helpful Memory Information:
- The Linux kernel tries to defer allocating dynamic memory to User Mode processes - those run in user space as opposed to kernel space.
- Page faults take place when a process requests for an address that has been allocated to it but has not yet been assigned to it.
- A minor page fault occurs when a process needs data that is in memory and is assigned to another process. Memory is shared between multiple processes - no additional data needs to be read from disk to memory.
- A major page fault occurs when a process needs to read in data from disk to memory pages.
- Swapping is when memory is unavailable for processes (vs disk cache).
- Swappinness prefers pages of a user mode process over disk cache pages when reclaiming memory.
- Inactive memory is the total amount of buffer or page cache memory that are free and available. Linux uses this cache to maintain data 'just in case'. Pages are reclaimed LRU (Least Recently Used). Inactive memory is 'extra', active memory is 'required'.
- Anonymous pages are in User Mode heap. They have no named file system source. Swap size must be big enough to hold anonymous pages.
- The kernel slab is memory being used for kernel mallocs. It helps eliminate fragmentation caused by allocations and deallocations.
- With z/VM 6.3 and higher, page space utilization will be higher. Functional alerts on page space usage is advised.
- VDISK has no overhead until 'touched'.
- When a buffer is dirty, it means the data is stored in cache but needs to be written to the underlying disk device first because it has been modified.
- Rule of thumb - if a server is not using swap, it is oversized. If a server is using some swap, it is sized correctly. If a server is using a lot of swap, it is undersized.
Helpful ESAMON screens/ESAMAP reports:
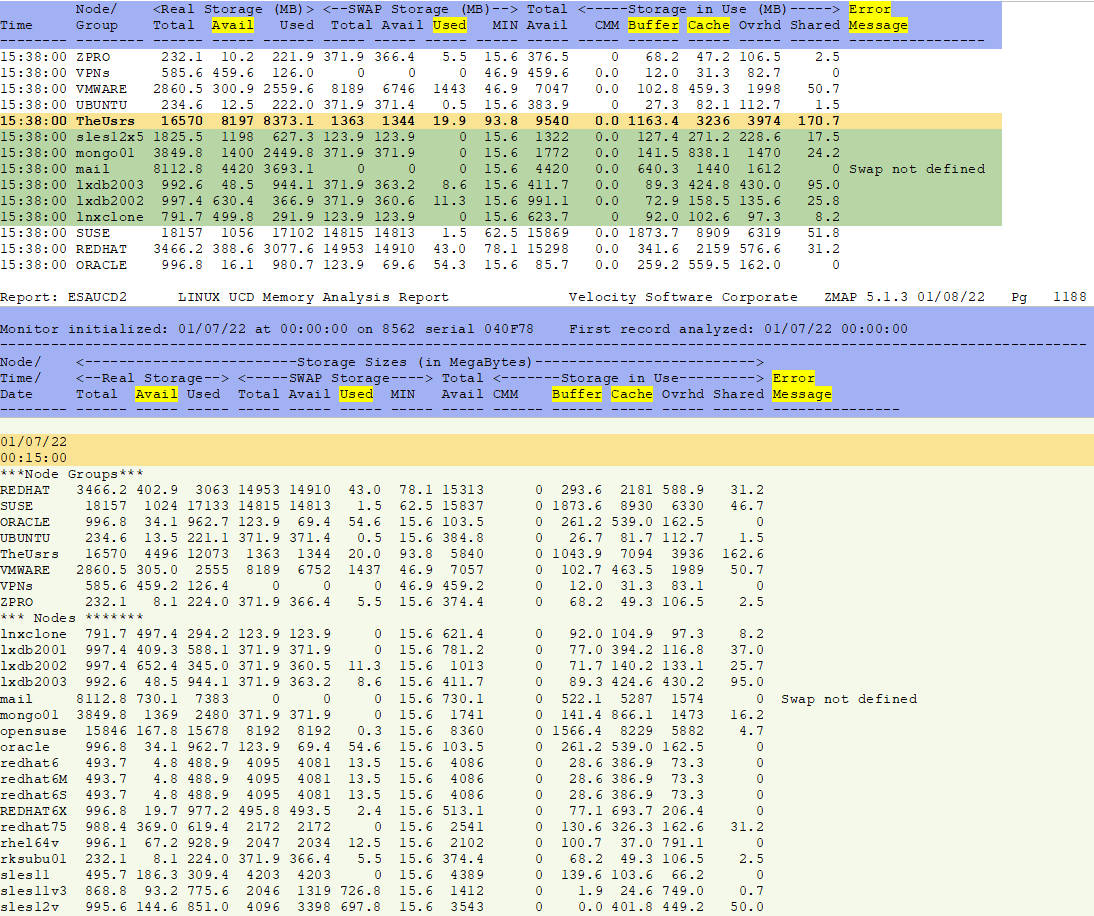
- ESAUCD2 - Linux UCD Memory Analysis - Shows information about the real and virtual memory.
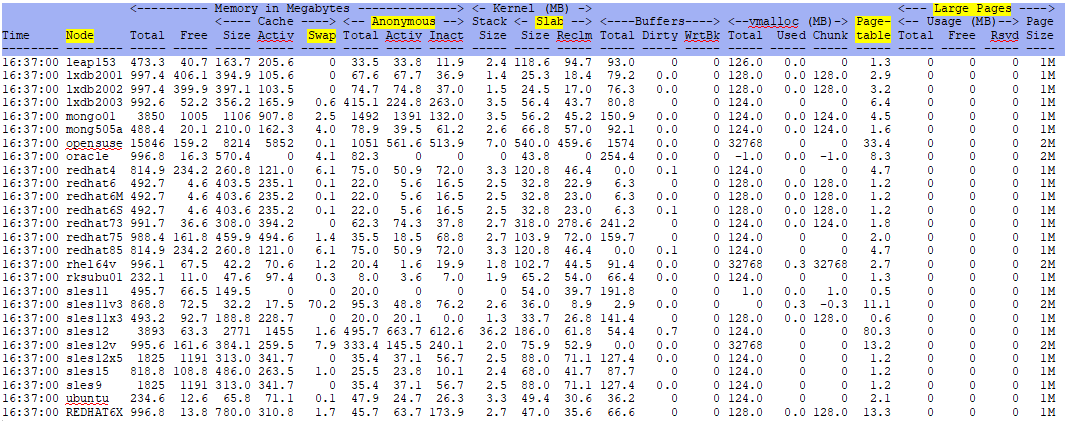
- ESALNXR - Linux Memory Analysis - Shows information about Linux memory. Good for Linux Admins
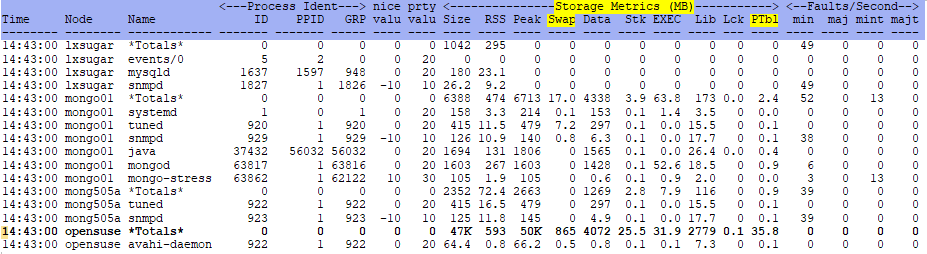
- ESALNXP - Linux Usage by Process - Shows statistical information about the Linux host and processes.
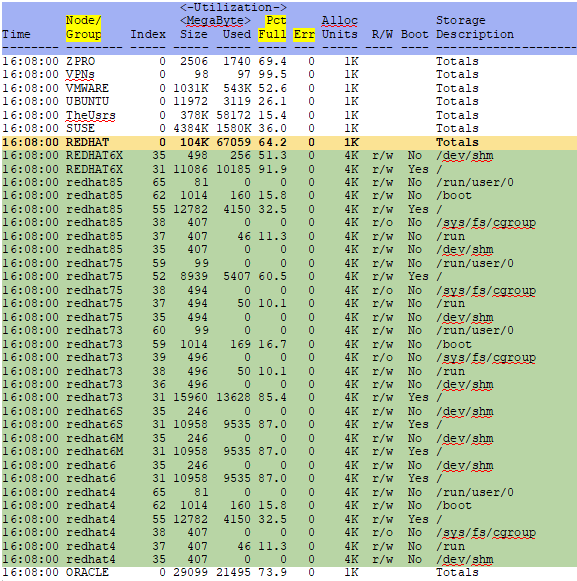
- ESAHST2 - Linux Host Storage Analysis - Shows information about the utilization of various types of memory.
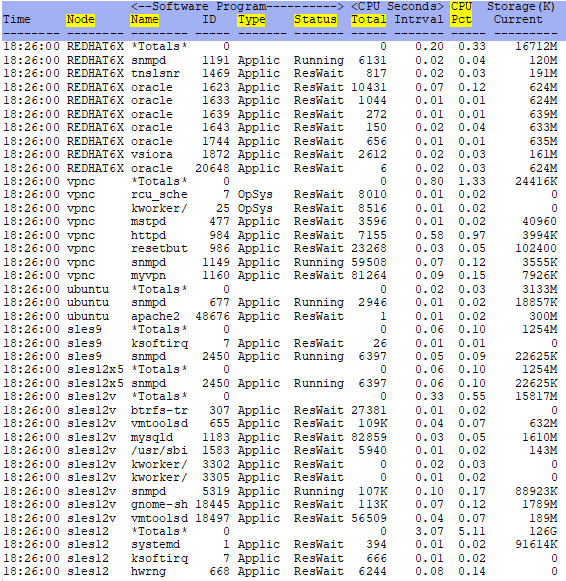
- ESAHST1 - Linux Host Software Analysis - Shows information about the software programs running.
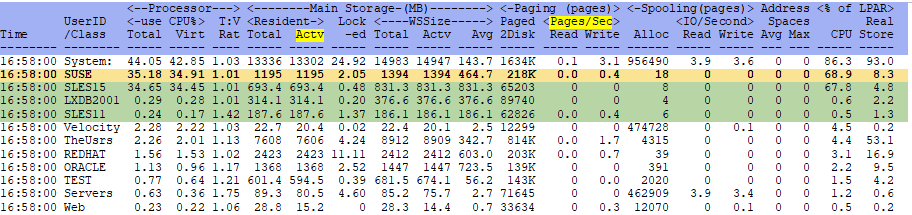
- ESAUSP2 - User Percent Utilization - Shows virtual machine utilization rate - main memory/paging.
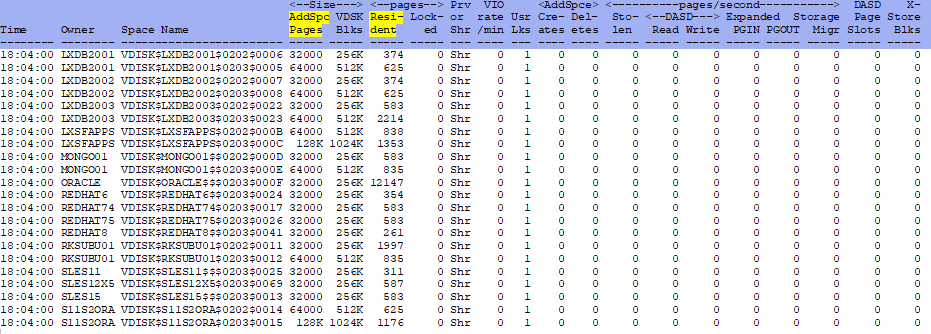
- ESAVDSK - VDISK Analysis - Shows VDISK paging activity.
If Linux memory is an issue, consider using zVRM
Using zVPS to find information for solving issues with the Linux memory:
ESAUCD2 - Shows the real and virtual memory for users.
ESALNXR - Shows the real and virtual memory for users.
ESALNXP - Shows memory information for processes.
ESAHST2 - Shows information about the utilization of various types of memory.
ESAHST1 - Shows information about the utilization of various types of memory.
ESAUSP2 - Shows more virtual machine main memory utilization information.
ESAVDSK - Shows VDISK paging activity.
Conclusions
The Memory subsystem has many performance knobs. It is worth the time to set it up properly and adjust early and often. Alerts and customized screen highlights are very helpful to quickly discover issues.
Back to top of page
Back to Performance Tuning Guide
