
LPAR Weights Analysis
Specifics - LPAR weights/overhead:
It is crucial for a well performing system to have the correct LPAR weights/shares or entitlement is defined. Understanding LPAR entitlement is critical to understanding CPU resources available to each LPAR.
- Entitlement is the amount of real CPU time each partition can use at its discretion.
- Entitlement for an LPAR with shared CPUs is a calculation of:
- The LPAR's weight
- The sum of the weights for all other shared partitions and
- The number of shared physical CPUs in the CPC.
- Note: The entitlement for an LPAR is split over all its engines. Therefore, if engines are added to an LPAR, the entitlement (or weight) needs to be reexamined.
- CPU polarization:
- Horizontal - each CPU gets an equal portion of the LPAR weight.
- Vertical-High - based on LPAR weighting, vertical high CPUs have high entitlement. It is entitled to run 100% busy.
- Vertical-Medium - based on LPAR weighting, vertical medium CPUs have medium entitlement. It can have any entitlement from 0-100% based on the partition's total entitlement and the number of logical CPUs sharing that entitlement.
- Vertical-Low - based on LPAR weighting, vertical low CPUs have low entitlement. It is entitled to nothing.
- High overhead and high thread idle time may indicate too many virtual CPUs (vCPUs) are defined.
- The accuracy of the current LPAR entitlement will be seen in the following screens.
- From a business planning perspective, this becomes a critical metric for providing specific workloads with the required processing power.
This presentation helps explain LPAR weights - CPU Analysis and Tuning for Linux on System Z
ESALPARS - Shows the processor sharing configuration and utilization for each LPAR. Examples of both ESALPARS report (daily) and screen (real time).
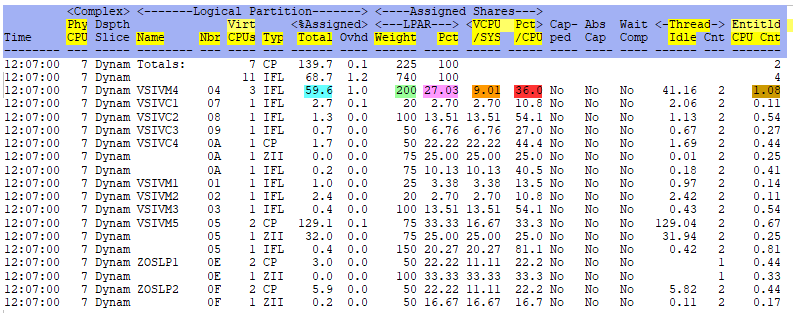
IE - Total assigned percentage for VSIVM4 for its IFL engines is currently 59.6%. (in teal)
IE - The weight for the VSIVM4 engines is 200. (in green)
IE - Total weight for IFL engines is 740, the weight for the VSIVM4 LPAR is 200 so its percent is 740/200=27.03% So VSIVM4 has 27.03% of the total assigned share. (in magenta)
IE - VSIVM4 has 3 IFL engines at 27.03%, each virtual CPU has 9.01%. (in orange)
IE - VSIVM4 is assigned 27.03% of the 4 IFLs (total physical IFLs), so a total 1.08% (27.03% x 4) or slightly over 1 IFL. (in brown)
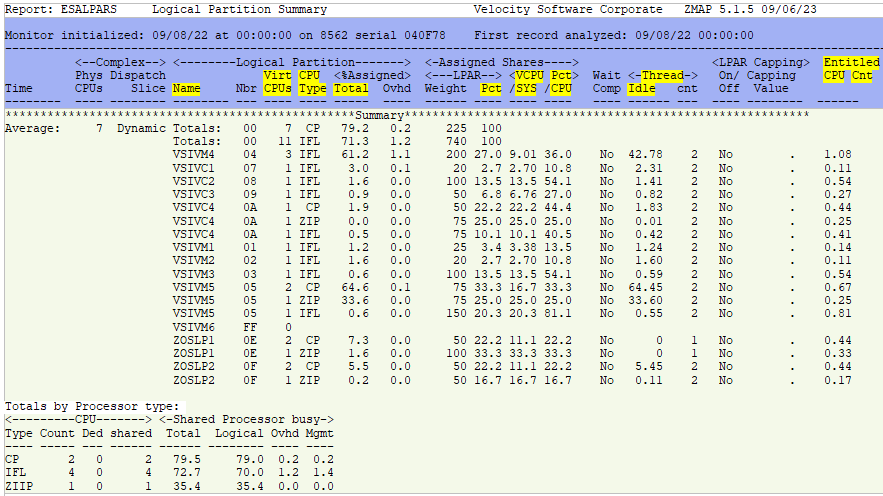
In this report, Logical = work being done, Ovhd = logical overhead and Mgmt = physical overhead.
NOTE: The Weight provided to an LPAR is divided into the virtual CPUs (vCPUs) of that LPAR so adding more vCPUs to an LPAR dilutes the impact of the weight! The weight must change if more vCPUs are added.
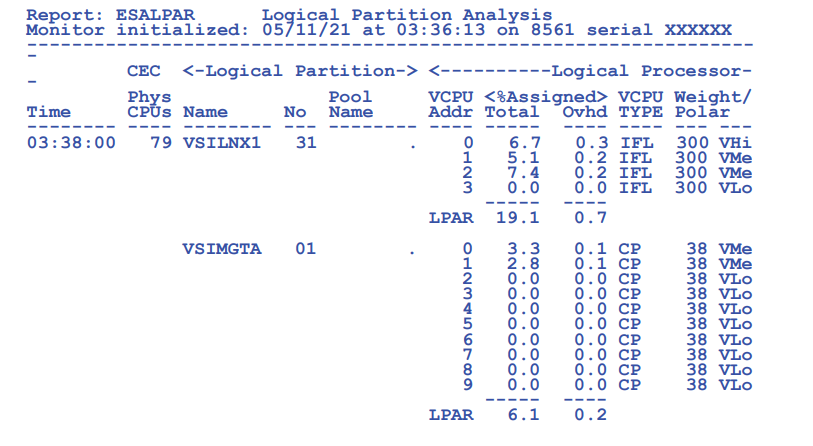
ESALPAR - Shows how the logical partition characteristics and processor utilization.
ESALPMGS - Shows how the hardware/processing resources are distributed in the box.
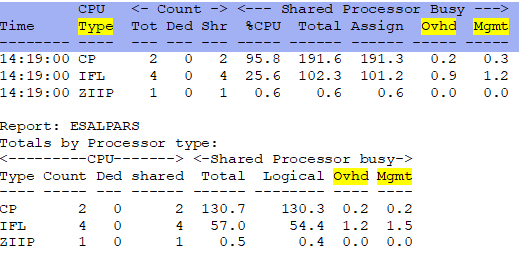
ESALPARS Example from another system - Shows the processor sharing configuration and utilization for each LPAR.
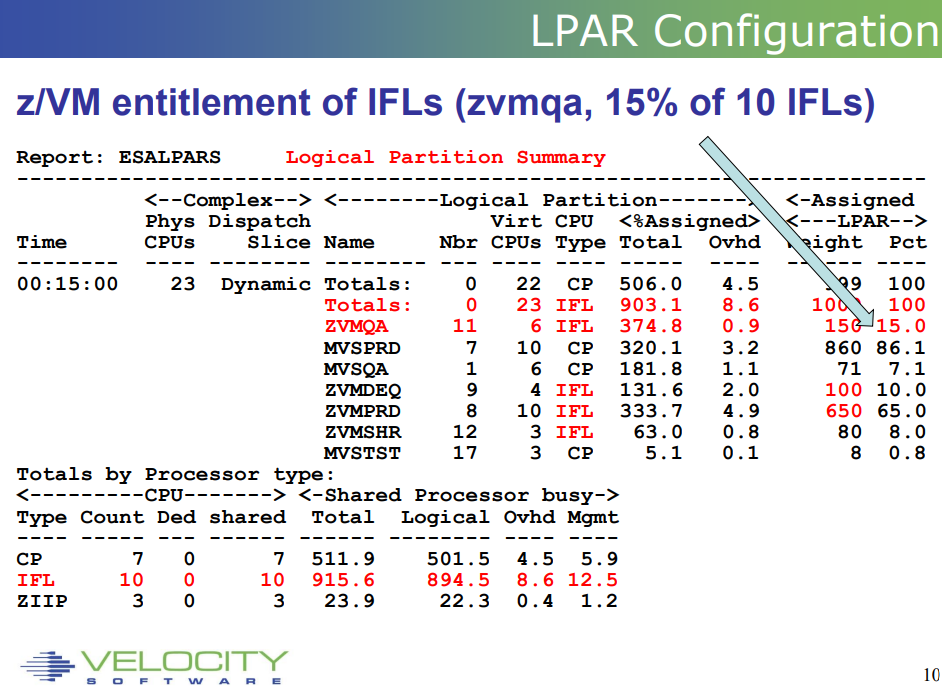
- This CEC has 10 total physical IFLs that are 915.6% busy. That is over 9 physical processors are being utilized. This can cause issues to be over 90% busy. This is way more important for online (Linux) vs batch.
- LPAR ZVMQA has 6 vCPUs with a weight of 150 It is using 374.8% or almost 4 out of 6 CPUs worth of processing. That is more than its share.
- LPAR ZVMPRD has 10 vCPUs with a weight of 650. It is using 333.7% or a little over 3 out of 10 CPUs worth of processing. It could be lowered to 8 or 9 vCPUs.
Back to top of page
Back to Flow Chart main page
