MongoDB Analysis
Linux Applications - Best Practices - MongoDB
Velocity Software has worked closely with MongoDB and specific clients to collect,
measure and report on approximately 140 metrics from the MongoDB perspective.
Unfortunately, MongoDB has deprecated SNMP support in version 6, leaving these
three ways to acquire the specfic metrics Velocity was previously able to acquire:
- Query the database directly
- Use MongoDB's Ops Manager
- Use MongoDB's Compass product
However, the reports below will still show all key attributes acquired from a Linux perspective.
MongoDB is an in-memory database, making memory management on of the key metrics. As MongoDB
charges customers by memory footprints, over allocation is expensive. This is especially true
if using IBM's Random Array of Independent Memory (RAIM).
There are suggestions below for alert thresholds. These are general. The optimal settings are application dependent
and will depend on the specific deployment of MongoDB.
ESAMON screens/ESAMAP reports:
MongoDB
- ESAMNG1 - MongoDB Configuration
- ESAMNG2 - MongoDB Processing
- ESAMNG3 - MongoDB Storage Analysis
- ESAMNG4 - MongoDB Workload
- ESAMNG5 - MongoDB Performance Analysis
Using zVPS to find information for solving issues with the Linux applications:
ESAMNG1 - Shows information about the MongoDB configuration.

Node - This shows the zTCP node name.
DB Size - This shows the total size of the database in MBs.
Real Memory Total/Avail/Used - This shows the memory usage. It shows the total size of the memory
allocated to the virtual machine, the available (or free) memory and the amount in use.
Mongo Version - This shows the level of MongoDB that is running.
Uptime - This shows how long the MongoDB has been up and running.
Replication/Health - This shows the health of the replication partner where '--' means no replica, '1'
means healthy. Set an alert for health status greater than 1.
Replication/Set Name - This shows the replica set name associated with this node.
Replication/State - This shows the state of the member of the replica set.
Replication/Primary - This shows the host name of the replica set or 'Sngl' if the node is not part of
a replica set.
ESAMNG2 - Shows information about the MongoDB processing.
Node - This shows the zTCP node name.
Connections Open - This shows the number of clients currently connected to the database server.
Connections Active - This shows the number of active connections to the database server. It is a good
idea to get a baseline for a "normal" number of connections and set an alert. If the number increases, verify
resources are being managed effectively or if the number decreases it could mean a nework or connection issue.
Ticket Threads/Reads/Writes - This shows the number of threads currently spawned by the database server,
the number of read tickets and write tickets available. Tickets represent the number of concurrent operations
allowed into the WiredTiger memory engine.
Op Latency Cmd/Read/Write - This shows the total time for an operation from start to completion (in ms)
for commands, reads and writes.
Working Cmd/Read/Write - This shows the internal working time for an operation (in ms) for commands, reads
and writes.
Network In/Out - This shows the inbound and outbound network kilobytes per second. Again, determine the
"average" counts and set alerts for high or low conditions
Disk Read/Write - This shows the disk read and write bytes per second.
ESAMNG3 - Shows information about the MongoDB memory.

Node - This shows the zTCP node name.
DB Size - This shows the total size of the database in Megabytes.
Real Memory Total/Avail/Used - This shows the data from Linux about the node (in Megabytes). It shows
the Total size of memory allocated to the virtual machine, the Available (or free) memory and the Used memory.
Mongo Memory Resident/Virtual - This shows the memory value (in Megabytes) in use by the database process -
both real and virtual.
Page Flts/Reclaim - This shows the number of Linux page faults (Flts) and the number of reclaimed pages
(Reclaim). Set an alert for a non-zero number in Flts, it could indicate a memory leak.
Evicted Modified/Unmodified - This shows the number of pages that were removed to make room for additional
data, both Modified and Unmodified.
Cache Used/Max - This shows the current (Used) and the maximum (Max) amount of memory used/allocated for the
WiredTiger cache.
ESAMNG4 - Shows information about the MongoDB databases.

Node Name - This shows the zTCP node name.
Primary/Secondary Rate Inserts - This shows the operation rates per second for inserts.
Primary/Secondary Rate Query - This shows the operation rates per second for queries.
Primary/Secondary Rate Update - This shows the operation rates per second for updates.
Primary/Secondary Rate Delete - This shows the operation rates per second for deletes.
Primary/Secondary Rate Getmore - This shows the operation rates per second for GETMORE.
Primary/Secondary Rate Cmds - This shows the operation rates per second for commands issued.
Op Totals Cmd/Read/Write - This shows the total number of operations for commands, reads from the database
and writes to the database.
Latency Cmd/Read/Write - This shows the total time for an operation from start to finish (in ms) for
command, read and write latency.
Working Cmd/Read/Write - This shows the internal working time for an operation from start to finish (in ms) for
commands, reads and writes.
Block Manager Pages Read/RdChkpt/Written/Dirty - This shows the WiredTiger Block Manager statistics - The
number of pages read, the number of checkpoint pages read, the number of pages written and the number of dirty pages in
cache.
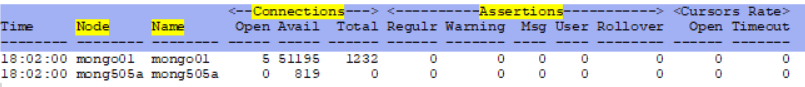
ESAMNG5 - Shows information about MongoDB performance.

Node - This shows the zTCP node name.
Active Clients Rdrs/Wrtrs - This shows the number of active clients connected to the database - the number reading
and the number writing. If there are continuous spikes in these numbers, it can mean the system is overloaded. It
would be helpful to set an alert if the condition lasts more than 5 minutes.
Current Queue Rdrs/Wrtrs - This shows the number of operations queued because of a lock - the number queued
readers and the number of queued writers.
Asserts - This shows the internal checks for errors by the database engine
Asserts Reg - This shows the regular assertions that are logged by the database engine.
Asserts Trip - This shows the Tripwire assertions that are fatal errors that flag the termination
of the database manager.
Asserts Msg - This shows the message assertions that are logged by the database engine.
Asserts User - This shows the user assertions that are application errors (like out of disk space,
duplicate key, etc).
Asserts Roll - This shows the number of times the assertion counter has rolled over.
Back to top of page
Back to Performance Tuning Guide

