Oracle Analysis
Linux Applications - Best Practices - Oracle
One thing to remember when setting up Oracle databases, more smaller servers are better than a few larger ones.
When there are smaller servers, several can be started at the same time and it shouldn't impact the system.
However, if even one 1TB server comes up, there is system impact. There is very little overhead in having
smaller granularity. z/VM tends to manage more smaller processes better than Linux handles larger ones.
When running Oracle (especially), defining HUGE pages is a benefit. Pages are by default 4K. HUGE pages are larger,
usually 1M, 2M or 1G.
ESAMON screens/ESAMAP reports:
Oracle
- ESAORAC - Oracle Database Configuration
- ESAORAG - Oracle SGA/PGA Analysis
- ESAORAS - Oracle Subsystem Analysis
- ESAORAW - Oracle Database Waits Analysis
Using zVPS to find information for solving issues with the Linux applications:
ESAORAC - Shows information about the Oracle database configuration.
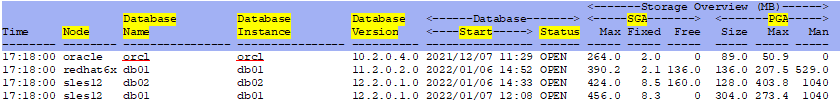
Node - This shows the zTCP node name.
Database Name - This shows the database name configured in /etc/oratab.
Database Instance - This shows the database instance name.
Database Version - This shows the database version.
Database Start - This shows the date and time the database was started.
Database Status - This shows the status of the instance. The status can be:
STARTED - After STARTUP NOMOUNT
MOUNTED - After STARTUP MOUNT or ALTER DATABASE CLOSE
OPEN - After STARTUP or ALTER DATABASE OPEN
OPEN MIGRATE - After ALTER DATABASE OPEN {UPGRADE | DOWNGRADE}
Storage Overview (MB) SGA - This shows the Shared Global Area maximum size, fixed allocations and
free memory.
Storage Overview (MB) PGA - This shows the Program Global Area size, size, maximum used and maximum used
when under manual memory management.
ESAORAG - Shows information about the Oracle SGA/PGA memory areas.
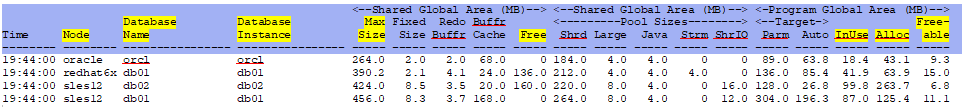
Node - This shows the zTCP node name.
Database Name - This shows the database name configured in /etc/oratab.
Database Instance - This shows the database instance name.
Shared Global Area (MB) Max Size - This shows the maximum SGA size.
Shared Global Area (MB) Free - This shows the the free memory available.
Program Global Area (MB) InUse - This shows the total PGA in use.
Program Global Area (MB) Alloc - This shows the currently allocated PGA memory.
Program Global Area (MB) Freeable - This shows the the amount of memory that could be freed back.
ESAORAS - Shows information about the Oracle subsystem.
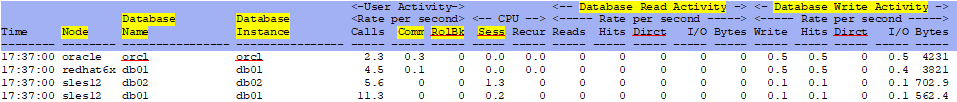
Node - This shows the zTCP node name.
Database Name - This shows the database name configured in /etc/oratab.
Database Instance - This shows the database instance name .
User Activity Comm - This shows the number of user commits. Commits often represent the closest thing to a
user transaction rate.
User Activity RolBk - This shows the number of times users manually issue the ROLLBACK statement or an error
occurs during a user's transactions.
CPU Sess - This shows the amount of CPU time (in 10s of milliseconds) used by a session from the time a
user call starts until it ends.
Database Read Activity Reads - This shows the total number of data blocks read from disk. This value can
be greater than the value of Dirct plus Hits as reads into process private buffers are also included.
Database Read Activity Hits - This shows the total number of data blocks read from disk into the buffer cache.
It is a subset of Reads.
Database Read Activity Dirct - This shows the number of reads directly from disk, bypassing the buffer cache
For example, in high bandwidth, data intensive operations such as parallel query,
reads of disk blocks bypass the buffer cache to maximize transfer rates and to prevent
the premature aging of shared data blocks resident in the buffer cache.
Database Write Activity I/O - This shows the number of read requests which read one or more database blocks for
all instance activity including application, backup and recover, and other utilities.
Database Write Activity Bytes - This shows the total size in bytes of all disk reads by application activity
only.
Database Write Activity Reads - This shows the total number of data blocks written to disk. This value equals
the value of Dirct plus Hits.
Database Write Activity Hits - This shows the total number of data blocks written to disk from the buffer cache.
It is a subset of Write.
Database Write Activity Dirct - This shows the number of writes directly to disk, bypassing the buffer cache
(as in a direct load operation).
Database Write Activity I/O - This shows the number of write requests for application activity (mainly buffer
cache and direct load operation) which wrote one or more database blocks per request.
Database Write Activity Bytes - This shows the total size in bytes of all disk writes by application activity
only.
ESAORAW - Shows information about the Oracle waits.

Node - This shows the zTCP node name.
Database Name - This shows the database name configured in /etc/oratab.
Database Instance - This shows the database instance name .
Rate per second Idle - This shows the rate per second for idle (inactive) waits and average time per wait.
Rate per second SysIO - This shows the rate per second for background process I/O waits and average time per
wait. For example, DBWR wait 'db file parallel write'.
Rate per second Concurr - This shows the rate per second for internal database resource waits and average time
for wait. For example, latches.
Rate per second User IO - This shows the rate per second for user I/O waits and average time per wait.
Rate per second Other - This shows the rate per second for other waits which should not typically occur on a
system. For example, 'wait for EMON to spawn'.
Rate per second Commit - This shows the rate per second for wait for redo log write confirmation after a commit
(log file sync).
Rate per second Config - This shows the rate per second for waits caused by inadequate configuration of database
or instance resources (such as undersized log file sizes or shared pool size).
Rate per second Applic - This shows the rate per second for waits resulting from user application code and
average time per wait. For example,
lock waits caused by row level locking or explicit lock commands.
Rate per second Network - This shows the rate per second for waits related to network messaging and average
time per wait. For example, 'SQL*Net more data to dblink'.
Back to top of page
Back to Performance Tuning Guide

