
MFC Analysis
Specifics - Understanding MFC Data:
MFC stands for MainFrame Cache. This cache is in the CEC or 'box'. This cache functions similar to cache on DASD, it is an area that holds recently used data so it is easily reaccessed. If this cache is used efficiently, performance improves. Unfortunately in the z/VM environment with so many guest systems like that do polling (like Linux, DB2, etc) or large amounts of I/O (like TPF), this cache tends to get easily overwritten and thus becomes inefficient. However, there are things that can be done to help maintain the best use of this cache.
Useful Terms and Information:
- First - In order to get MFC data, the Measurement Facility must be turned on in the LPAR. See Enabling CPUMFC Records
- MFC data is by thread. This is important.
- The levels of cache are:
- L1 cache - This area is on the core (private) and is the fastest and most efficiently used. All instruction and data information for a transaction must be in L1 cache before it can be run.
- L2 cache - This area is also on the core (private), is usually larger than L1 but is also slightly slower.
- L3 cache - This area is shared by all of the cores on the same chip.
- L4L cache - This area is shared by all of the cores on the same local book.
- L4R cache - This area is shared by all of the cores on the same different/remote book.
- Memory - This area is actual memory - it means the data was not in any level of cache.
- There are cycles wasted waiting for data to come from other areas of cache. SMT was created to increase efficiency by utilizing those 'wasted' cycles. The less cycles wasted, the more work that can get done.
- CPI - Cycles per instruction. This is a very important measurement of performance. A lower CPI means that more
instructions are possible. A higher CPI means that there is higher CPU utilization and possibly contention.
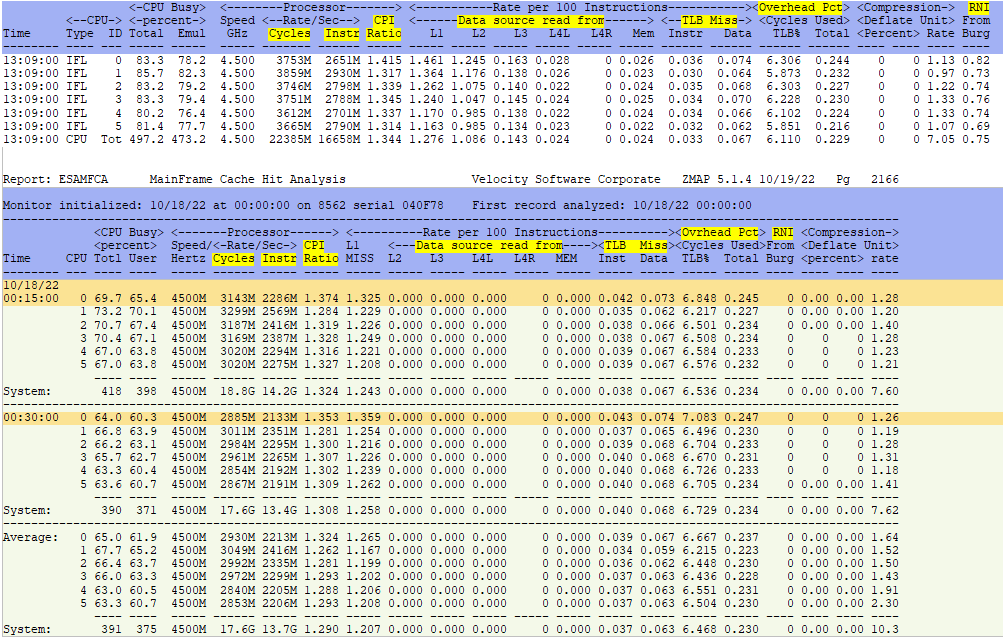
When Instructions go up and cycles go down - it's a good thing. Watch the CPI Ratio on ESAMFCA (lower is good). - RNI - Relative Nest Intensity. This is a concept created by John Burg at WSC. Velocity uses his calculations.
However, we have found it does not track well for the high dispatch rates for Linux.
It also does not account for address translation which can be considerable. - TLB - Transaction Lookaside Buffer. In order to move data from other cache levels or memory to L1 cache, addresses
need to be translated. Dynamic Address Translation handles this.
There was only one DAT per box, however later boxes have gone from one DAT to four DATs to help increase the efficiency and performance of this process. - When setting up LPAR hardware, be sure to set cores up as much as possible on the same CHIPs and nodes/books.
- Note: Adding virtual CPUs to a server that tend to access the same data to cache contention and can negatively affect performance. Only define as many vCPUs as is needed for the workload! If customers demand additional vCPUs when they are not needed, Velocity's zVRM product can help.
Tips For Using MFC Data:
- Watch the ESAMFC screen for TLB CPU Cost. A typically healthy environment seems to use about 10% of the cycles (or less) for address translation. Numbers above 20% should be investigated.
- Watch the ESAMFC screen/report for 'Ratio' to get CPI. Get a baseline read of the number. Again, the lower the ratio, the more work that is getting done. If this number is high without SMT, do not turn SMT on.
- Watch the ESAMFC screen/report for TLB CPU Cost. The higher the number, the less work is getting done.
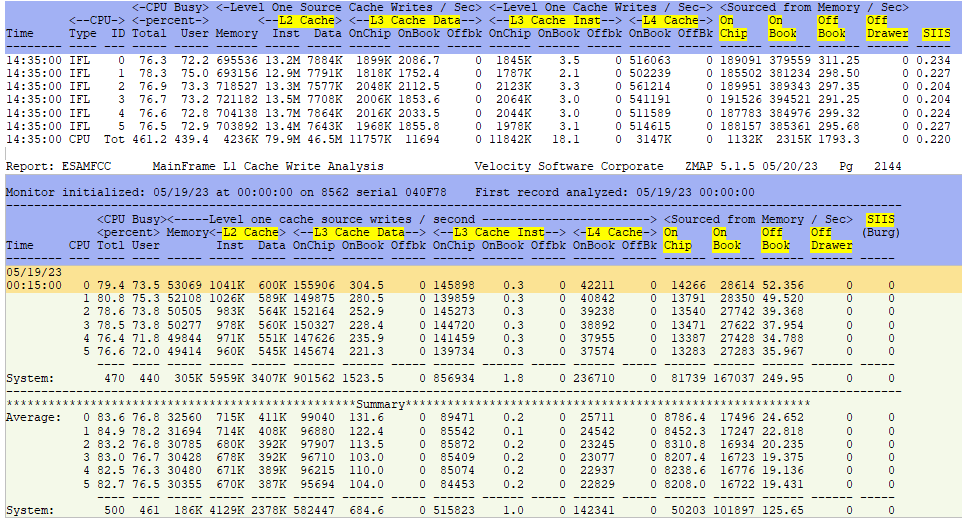
- Watch the ESAMFCA and ESAMFCC screens/reports for the data read from L2/L3/L4L/L4R/Memory. If there are large amounts of data read from the further areas, especially Off-Drawer, it could be a hardware configuration issue.
- Use the fewest amount of vCPUs possible to get the workload done. The more vCPUs that are running that are not needed will cause cache inefficiencies.
Helpful ESAMON screens/ESAMAP reports:
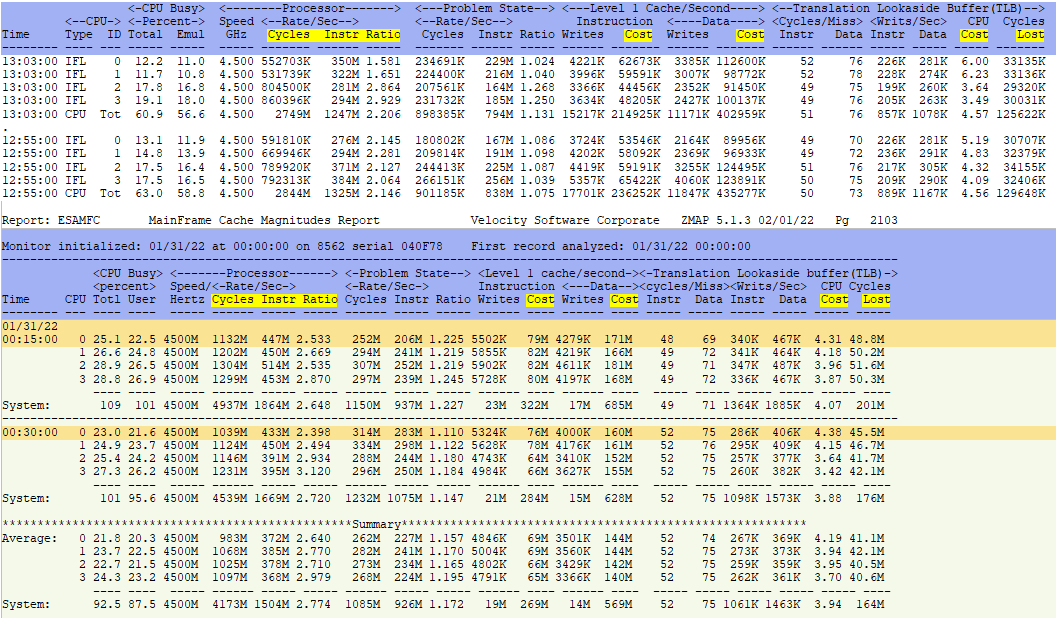
- ESAMFC - Processor Cache Analysis - Shows processor instruction information
- ESAMFCA - Processor Cache Hit Analysis - Shows processor cache hit information
- ESAMFCC - Processor L1 Cache Write Analysis - Shows processor Level one cache write information
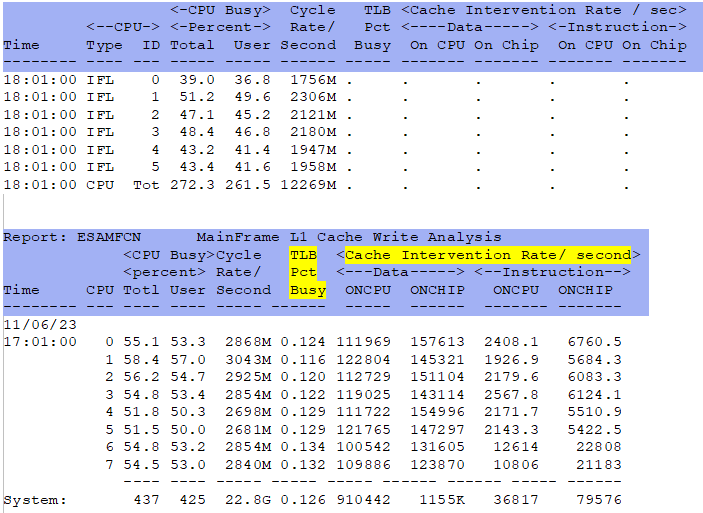
- ESAMFCN - Processor Cache Intervention Analysis - Shows processor cache intervention analysis
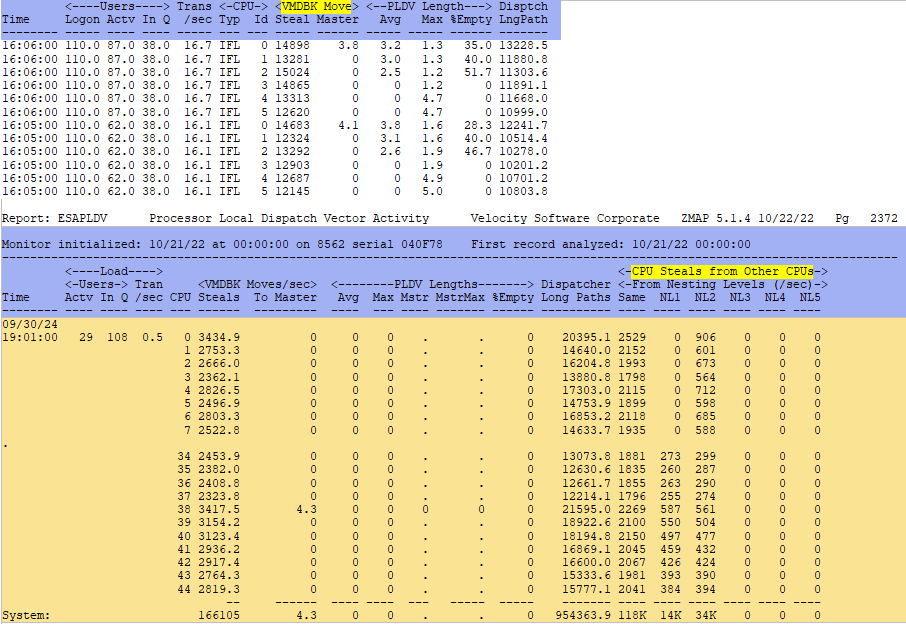
- ESAPLDV - Processor Local Dispatch Vector Activity - Shows the dispatcher activity
ESAMFC - Shows processor instruction information.
ESAMFCA - Shows processor cache hit information.
ESAMFCC - Shows processor L1 cache write analysis.
ESAMFCN - Shows processor L1 cache intervention analysis.
ESAPLDV - Shows processor local dispatch vector activity
Back to top of page
Back to Flow Chart main page
