Network Subsystem Analysis
Network Analysis
Network issues can cause an overload on the system. Knowing the different network components can be very helpful in
determining where a "network issue" may be happening - such as channel issues are mainframe hardware related.
The z17 introduced many changes to the channel environment. The following presentation covering these changes:
Introduction to z17 Channel Performance Management
Helpful tips:
TCPIP should have the following option set to provide optimum service: SET SHARE TCPIP ABS 5%
(This ensures TCPIP is not over prioritized as the default of REL 3000 does.)
To alleviate any issues with the TCPIP Velocity screens - be sure to set FOREIGNIPCOMLIMIT to 192. See
z/VM TCPIP Changes for 7.2 for more information.
As of z/VM 7.3, TCPIP needs to have the following parm set: UDPQUEUELIMIT 0 in the Assortedparms section of the
fn TCPIP file to override the default of 20.
This will give SNMP sufficent resources to monitor Linox or VSE.
When doing Live Guest Relocation (LGR), be sure to set up the ssiflag/Peer IP address in your ZTCP (ESATCP PARMS file)
so each server will be monitored from the correct LPAR.
When FTPing to/from z/VM, use the following settings to help performance (Select values that are consistent with
the number of consistent sessions):
DataBufferPoolSize 32K
DataBufferLimits 128
Helpful ESAMON screens/ESAMAP reports:
- ESATCPI - TCPIP Interface Screen - Shows information from the Internet Control Message Protocol (ICMP) layer.
- ESATCP4 - TCPIP Hardware Layer / Interfaces - Shows errors from the ICMP layer.
- ESAQDIO - Queued I/O Report - Shows information on the I/O activity for each QDIO device.
- ESANIC - Virtual NIC Activity - Shows information about virtual network interface card activity.
- ESAVSW - Virtual Switch Utilization - Shows information about the virtual switch being monitored.
ESATCPI - Shows TCPIP interface information from the ICMP layer
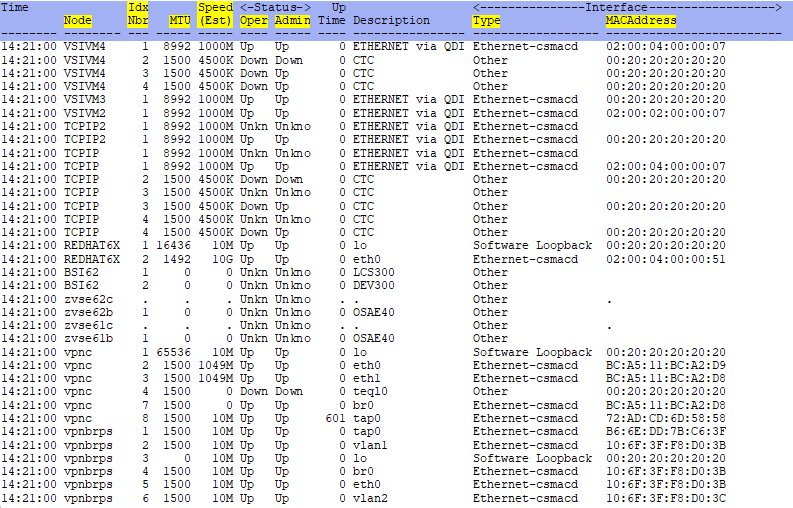
Node/Idx Nbr - This is the zTCP node name and index number if there are multiple nodes.
MTU - This shows the Maximum Transmission Unit for that node. MTU size should be above 1501.
Speed - This shows the estimated speed of the interface.
Status - This shows the status of the interface from both an operational and an administrative point of view.
Type/MACAddress - This shows the type of interface and the MAC address. Notice some MAC addresses are
virtual.
ESATCP4 - Shows TCPIP interface information from the hardware layer and errors from the ICMP and hardware layers.
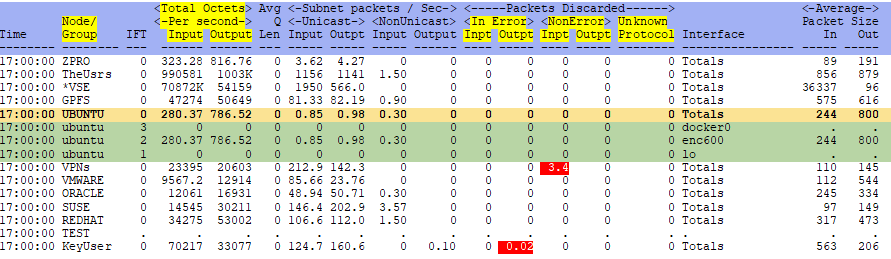
Node/Group - This is the zTCP node or group name. Can click (zVIEW) or zoom (z/VM) to see the all the nodes in
a group.
Total Octets per second Input/Output - This shows the rate of transmission at this level. It is good to be
familiar with the typical rate to be able to recognize when this rate
goes up beyond expectations, which could signify a problem or a network overrun.
If the total octets per second - input number goes over 500,000, that it excessive.
Packets Discarded - This shows how many packets have been discarded due to errors, a reason other than an error,
and for having an unknown protocol. Investigate consistent or a significant number of errors.
ESAQDIO - Shows Queued Input/Output (QDIO) activity for each QDIO device
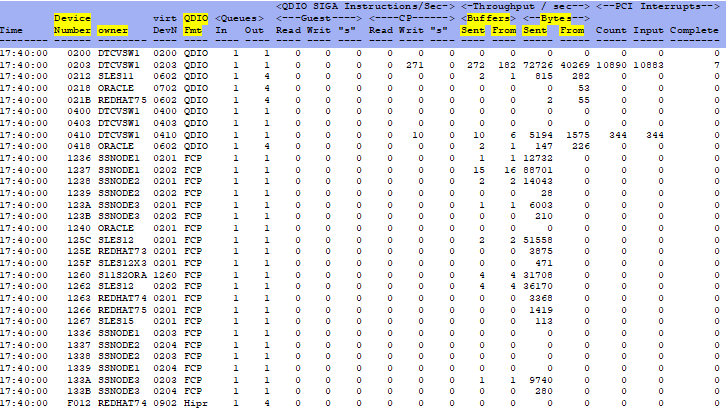
Device Number - This is the real QDIO device number.
Owner - This is the userid of the owner of the device.
QDIO Fmt - This is the format of the device - QDIO, FCP or HiperSocket.
Throughput/sec - This is the throughput in Buffers and Bytes that have been sent to or taken from the
adapter. This is another area that knowing the typical rate is help to
recognize when that rate is higher than normal, which could signify a problem or a
network overrun.
ESANIC/ESATCP4 - Shows guest LAN / virtual switch activity. ESANIC uses CP monitor data. ESATCP4 uses SNMP data.
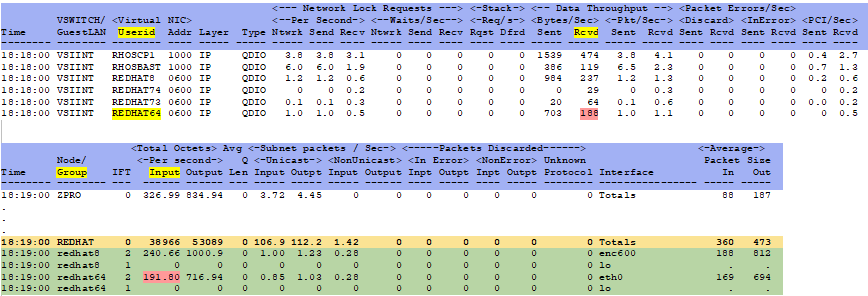
ESANIC-Userid ESATCP4-Node/Group - Match up names from each screen.
ESANIC-Rcvd ESATCP4-Total Octets Input - These numbers should be very close (ESATCP4 will be slightly ahead).
ESAVSW - Shows virtual switch activity
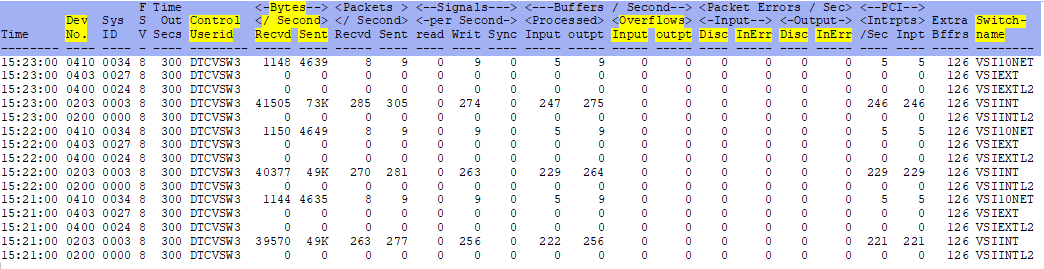
Dev No. - This is the device number of the virtual switch (vSwitch).
Control Userid - This is the virtual machine that is controlling the virtual switch.
Bytes/Second Recvd Sent - This is the total number of bytes received and sent per second. Look for large
fluctuations.
Buffers/Second Overflows - This shows the number of input/output queue overflows per second. Look for
overflows.
Packet Errors/Sec - This shows the packet errors per second (discarded and packets in error). Look for
errors.
Switch name - This is the name of the virtual switch.
Conclusions
The stability and efficiency of the network affects the performance of the system. A large influx of network messages
or a component of the network performing poorly will cause slow response times or possibly a system outage. A network
with incorrect definitions will cause user headaches.
Back to top of page
Back to Performance Tuning Guide

