VSE Network Analysis
VSE Network - Best Practices
Helpful processing information:
- Networking configuration:
- The information below is for the CSI TCPIP stack provided by Connectivity Systems, Inc. (CSI).
Helpful ESAMON screens/ESAMAP reports:
- ESACSI1 - VSE CSI TCPIP Network Activity - Shows information about the CSI TCPIP stack on the VSE system.
- ESACSI2 - VSE CSI TCPIP Application Activity - Shows information about the CSI TCPIP applications on the VSE
system.
Using zVPS to find information for solving issues with the VSE Networking:
ESACSI1 - Shows information about
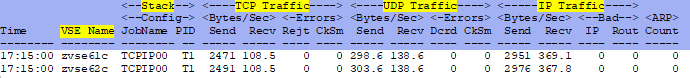
VSE Name - This shows the name of the VSE system as defined in the zTCP NODE file.
Stack Config JobName - This shows the TCPIP stack job name.
Stack Config PID - This shows the TCPIP stack partition ID.
TCP Traffic Send - This shows the bytes per second sent.
TCP Traffic Recv - This shows the bytes per second received.
TCP Traffic Rejt - This shows the datagrams rejected due to no listening connection.
TCP Traffic CkSm - This shows the datagrams rejected due to checksum error.
UDP Traffic Send - This shows the bytes per second sent.
UDP Traffic Recv - This shows the bytes per second received.
UDP Traffic Rejt - This shows the datagrams rejected due to no listening connection.
UDP Traffic CkSm - This shows the datagrams rejected due to checksum error.
IP Traffic Send - This shows the bytes per second sent.
IP Traffic Recv - This shows the bytes per second received.
IP Traffic Bad IP - This shows the number of either malformed datagrams or host marked as refused.
IP Traffic Bad Rout - This shows the datagrams that are misdirected.
ESACSI2 - Shows information about

VSE Name - This shows the name of the VSE system as defined in the zTCP NODE file.
Stack Config JobName - This shows the TCPIP stack job name.
Stack Config PID - This shows the TCPIP stack partition ID.
Telnet Daemons - This shows the number of defined, active and maximum number of active telnet daemons.
Telnet KB/Sec Sent - This shows number of telnet bytes sent - KB/sec.
Telnet KB/Sec Recv - This shows number of telnet bytes received - KB/sec.
FTP Daemons - This shows number of defined, active and maximum number of active FTP daemons.
FTP KB/Sec Sent - This shows number of FTP bytes sent - KB/sec.
FTP KB/Sec Recv - This shows number of FTP bytes received - KB/sec.
Conclusions
Network transaction errors or an overrun of network traffic can cause system performance issues and slow response times
for applications and other workloads. It is helpful to periodically check the above reports to get a good feel for what
is 'normal' for the system to know when problems arise.
Back to top of page
Back to Performance Tuning Guide

