CICS Resource Analysis
z/OS CICS Resources - Best Practices
Helpful information:
- Fields come from CICS SMF records:
- ZOSCIX1 - CICS SMF data - record type 110 - subtype 1
- ZOSCIX5 - CICS SMF data - record type 110 - subtype 1
- ZOSCIXS1 - DSECT DFHSMSDS
- ZOSCIXS2 - DSECT DFHDSGDS
- Field names are noted in parenthesis after the description.
Helpful ESAMON screens/ESAMAP reports:
- ZOSCIX1 - CICS Analysis - This shows information abou the individual CICS systems.
- ZOSCIX5 - CICS Transaction Storage Analysis - This shows information about the CICS transaction memory.
- ZOSCIXS1 - CICS DSA Detail - This shows details about the Dynamic Storage Area.
- ZOSCIXS2 - CICS TCB Activity - This shows information about the TCB activity.
Using zVPS to find information for solving issues with the CICS Resources:
ZOSCIX1 - Shows information about the individual CICS systems.

SYSID - This shows the system ID on which CICS is running.(SMFMNSID)
CICS Program APPLID - This shows the application ID of the CICS region.(SMFMNSPN)
CICS Program JobName - This shows the jobname of the CICS region.(SMFMNJBN)
Start Date/Time - This shows the date and time that the CICS region was started.(SMFMNRSD/SMFMNRST)
Platform O/S - This shows the name of the operating system on which the CICS region is running.(SMFMNFLG)
Platform VRM - This shows the version indicator of the CICS region.(SMFMNRVN)
Location LPARName - This shows the name of the LPAR on which the CICS region is running.(LPARNAME)
Location VMID - This shows the name of the virtual machine on which the CICS region is running (for z/VSE
running under z/VM.
Transactions Total - This shows the count of the total number of transactions in the interval.
Transactions Resp - This shows the average response time of the transactions in the interval.(STOP-START)
Transaction response time is made up of Suspend Time + Dispatch Time.
Transactions CPU - This shows the average CPU time of the transactions in the interval.(USRCPUT)
Task Statistics Total - This shows the total transaction count.(STID 10 - DSECT DFHXMGDS - XMGNUM)
Task Statistics MXT - This shows the MAXTASK value for this region.(STID 10 - DSECT DFHXMGDS - XMGMXT)
Task Statistics Actv - This shows the number of active transactions for this CICS region.
(STID 10 - DSECT DFHXMGDS - XMGCAT)
Task Statistics Qued - This shows the MAXTASK queue time.(STID 10 - DSECT DFHXMGDS - XMGTQTME/XMGTAT)
Task Statistics PctM - This shows the percentage of active transactions to the MAXTASK value.
ZOSCIX5 - Shows information about the CICS transaction memory.
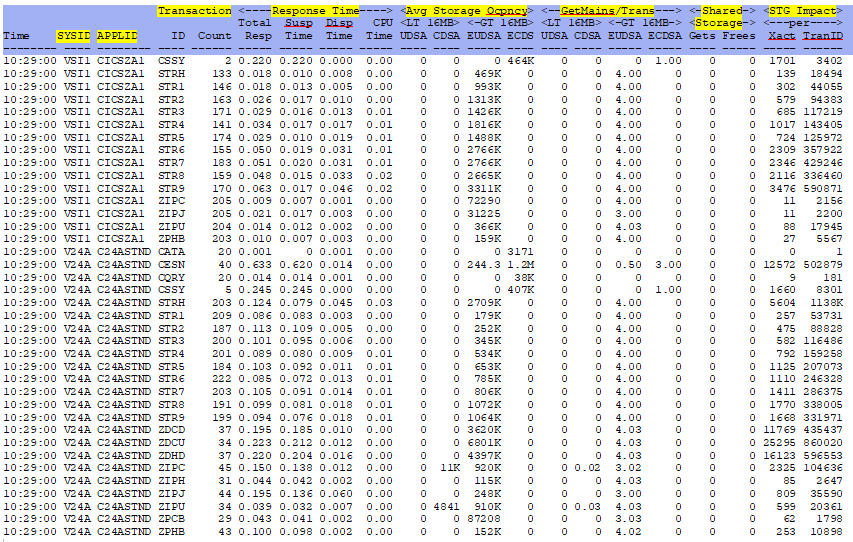
SYSID - This shows the system ID on which CICS is running.(SMFMNSID)
APPLID - This shows the application ID of the CICS Region.(SMFMNSPN)
Transaction ID - This shows the transaction identifier.(TRAN)
Transaction Count - This shows the number of terminated transactions for the interval
Response Time Total Resp - This shows the total reponse time per transaction in seconds.(TOTRESP)
Response Time Susp Time - This shows the suspend time per transaction in seconds.(SUSPTIME)
Response Time Disp Time - This shows the dispatch time per transaction in seconds.(USRDISPT)
Response Time CPU Time - This shows the CPU time per transaction in seconds.
Avg Storage Ocpncy <16MB UDSA - This shows the user DSA below 16M - the area under the curve of user-task
memory in use against elapsed time.
Avg Storage Ocpncy <16MB CDSA - This shows the CICS DSA below 16M - the area under the curve of user-task
memory in use against elapsed time.
Avg Storage Ocpncy >16MB EUDSA - This shows the user DSA above 16M - the area under the curve of user-task
memory in use against elapsed time.
Avg Storage Ocpncy >16MB ECDSA - This shows the CICS DSA above 16M - the area under the curve of user-task
memory in use against elapsed time.
GetMains/Trans <16M UDSA - This shows the number of GETMAINS per transaction for user DSA below 16M.
GetMains/Trans <16M CDSA - This shows the number of GETMAINS per transaction for CICS DSA below 16M.
GetMains/Trans >16M EUDSA - This shows the number of GETMAINS per transaction for user DSA above 16M.
GetMains/Trans >16M ECDSA - This shows the number of GETMAINS per transaction for CICS DSA above 16M.
Shared Storage Gets - This shows the number of shared memory GETMAIN bytes below 16M.
Shared Storage Frees - This shows the number of shared memory FREEMAIN bytes below 16M.
STG Impact Xact - This shows the memory impact per transaction.
STG Impact TranID - This shows the memory impact per transaction ID.
ZOSCIXS1 - Shows details about the Dynamic Storage Area.
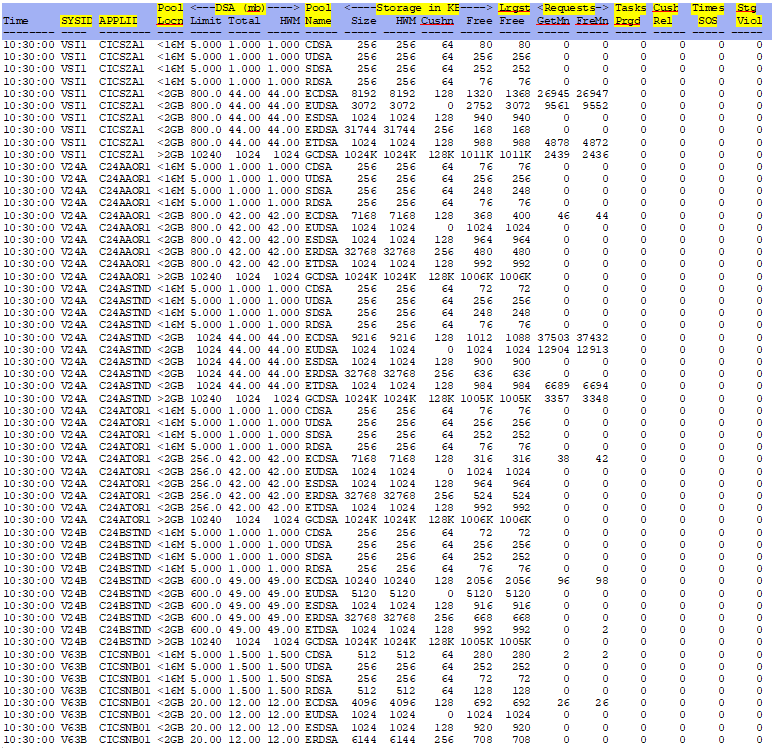
SYSID - This shows the system ID on which CICS is running.(SMFMNSID)
APPLID - This shows the application ID of the CICS Region.(SMFMNSPN)
Pool Locn - This shows the memory location of the DSA.(SMSLOCN)
DSA Limit - This shows the DSA limit value as indicated in DFHSIT.(SMSDSALIMIT/SMSEDSALIMIT/MEMLIMIT)
DSA Total - This shows the current DSA total.(SMSDSATOTAL/SMSEDSATOTAL/SMSGDSAALLOC)
DSA HWM - This shows the DSA High Water Mark.(SMSHWMDSATOTAL/SMSHWMEDSATOTAL/SMSHWMGDSAAL)
Pool Name - This shows the individual DSA Name.(SMSDSANAME)
Storage Size - This shows the current size of the DSA.(SMSDSASZ)
Storage HWM - This shows the High Water Mark of the DSA.(SMSHWMDSASZ)
Storage Cushn - This shows the current cushion size.(SMSCSIZE)
Storage Free - This shows the free storage (including cushion).(SMSFSTG)
Lrgst Free - This shows the largest free area in the DSA.(SMSLFA)
Requests GetMn - This shows the number of GETMAIN requests.(SMSGMREQ)
Requests FreMn - This shows the number of FREEMAIN requests.(SMSFMREQ)
Tasks Prgd - This shows the number of tasks purged waiting on storage.(SMSPWWS)
Cush Rel - This shows the number of times cushion released.(SMSCREL)
Times SOS - This shows the number of times SOS (Short On Storage) occured.(SMSSOS)
Stg Viol - This shows the number of memory violations.(SMSSSV)
ZOSCIXS2 - Shows details about the TCB activity.
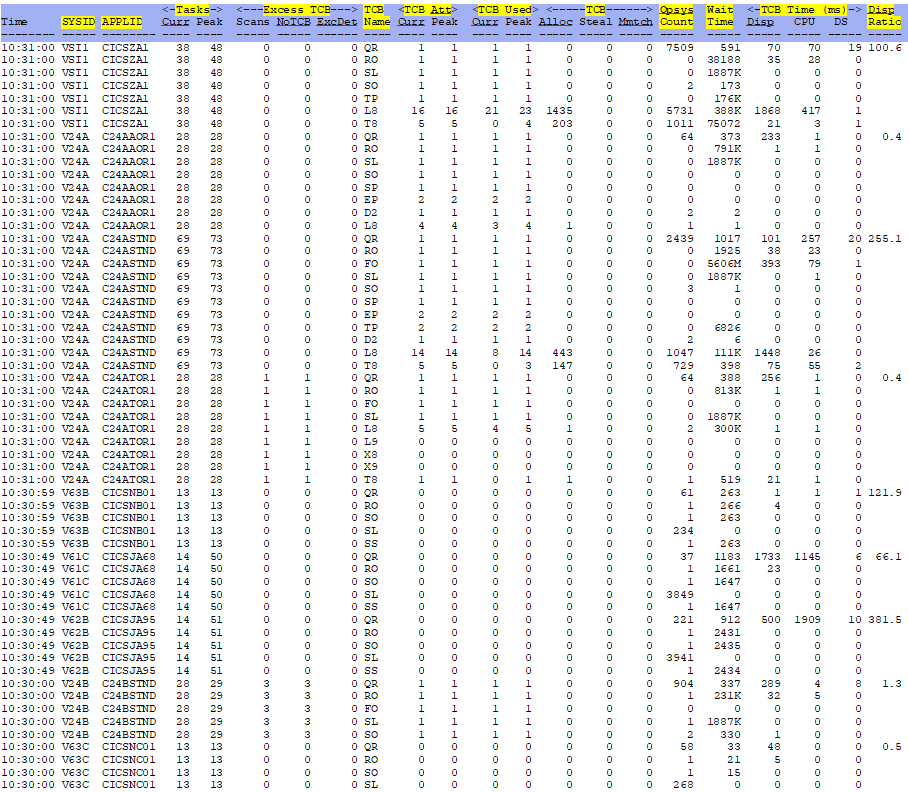
SYSID - This shows the system ID on which CICS is running.(SMFMNSID)
APPLID - This shows the application ID of the CICS Region.(SMFMNSPN)
Tasks Curr - This shows the current number of tasks.(DSGCNT)
Tasks Peak - This shows the peak number of tasks.(DSGCNT)
Excess TCB Scans - This shows the number of excess TCB scans.(DSGXSCNS)
Excess TCB NoTCB - This shows the number of scans during which no TCB was detached.(DSGXSCNN)
Excess TCB ExcDet - This shows the number of excess TCBs that were detached.(DSGXSCBD)
TCB Name - This shows the TCB mode name.(DSGTCBNM)
TCB Att Curr - This shows the current number of TCBs attached.(DSGTCBCA)
TCB Att Peak - This shows the peak number of TCBs attached.(DSGTCBPA)
TCB Used Curr - This shows the current number of TCBs used by mode.(DSGTCBCU)
TCB Used Peak - This shows the peak number of TCBs used by mode.(DSGTCBPU)
TCB Alloc - This shows the current number of TCBs allocated to tasks.(DSGTCBAL)
TCB Steal - This shows the number of TCBs steals.(DSGTCBST)
TCB Mmtch - This shows the number of TCBs mismatches.(DSGTCBMM)
Opsys Count - This shows the number of partition exits.(DSGSYSW)
Wait Time - This shows the real time CICS in OS Wait in ms.(DSGTWT)
TCB Time Disp - This shows the real time TCB dispatched in ms.(DSGTDT)
TCB Time CPU - This shows the CPU time for TCB in ms.(DSGACT)
TCB Time DS - This shows the CPU time used by this TCB for dispatcher tasks.(DSGTCT)
Disp Ratio - This shows the ratio of CPU time to Dispatch time.((DSGACT/DSGTDT)*100)
Conclusions
Back to top of page
Back to Performance Tuning Guide

