CICS Transaction Analysis
CICS Transactions - Best Practices
Response time reporting is done at several levels. One measure is total transactions for the CICS region. Another method
is reporting by transaction names. For response time, we evaluate the terminated transactions. There is another class of
transactions that are long term or "inflight". Though these do not have response times, their performance man be critical
and the resources consumed by inflight trnsactions may impact others or be impacted by others.
There is dispatch time (where work is being done) that includes CPU/ZIIP time and suspend time (where work is delayed).
Dispatch time also includes time to load the program (PC Load time) if the programs are not pre-loaded. Suspend time has
many components. The ZVPS screens/reports will show this data. It is good to review these over a period of time to
determine what is normal and acceptable. Once that is determined, zALERT can be used to notify concerned parties that these
numbers have been surpassed.
Helpful information:
- Fields come from CICS SMF records:
- ZOSCIX2 - CICS SMF data - record type 110 - subtype 1
- ZOSCIX3 - CICS SMF data - record type 110 - subtype 1
- ZOSCIX4 - CICS SMF data - record type 110 - subtype 1
- Field names are noted in parenthesis after the description.
Helpful ESAMON screens/ESAMAP reports:
- ZOSCIX2 - CICS Transaction Analysis - This shows transaction activity by Region.
- ZOSCIX3 - CICS Transaction Wait Analysis - This shows transaction wait activity.
- ZOSCIX4 - CICS Detailed Transaction Analysis - This shows CICS transaction details.
Using zVPS to find information for solving issues with the CICS Transactions:
ZOSCIX2 - Shows information about the CICS
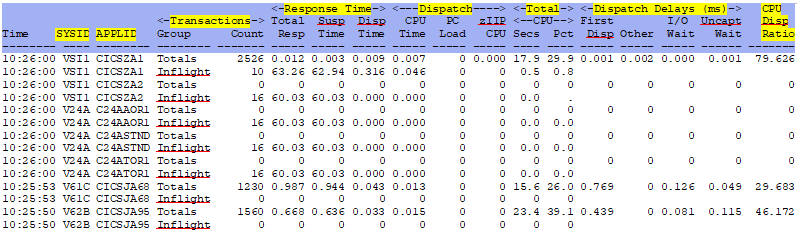
SYSID - This shows the system ID on which CICS is running.(SMFMNSID)
APPLID - This shows the application ID of the CICS Region.(SMFMNSPN)
Transactions Group - This shows whether this line of data refers to Inflight transactions (Inflight) or
Terminated transactions (Total).
Transactions Count - This shows the number of transactions in the group for the interval.
Response Time Total Resp - This shows the response time of the transactions for the interval. Response time
is calculated from transaction stop time
minus transaction start time.(STOP-START) Transaction response time is made up of
Suspend Time + Dispatch Time.
Response Time Susp Time - This shows the average suspend time of the transactions for the interval.
(SUSPTIME)
Response Time Disp Time - This shows the dispatch time of the transactions for the interval.
(USRDISPT)
Dispatch CPU Time - This shows the average CPU time of the transactions for the interval.(USRCPUT)
Dispatch PC Load - This shows the average time used to load programs into storage for the interval.
(PCLOADTM)
Dispatch zIIP CPU - This shows the average CPU time the transaction spent running on a zIIP processor.
(USRCPUT-CPUTONCP) This value is a component of CPU time.
Total CPU Secs - This shows the total CPU time in secondsfor all of the transactions in this group.(USRCPUT)
Total CPU Pct - This shows the total CPU time percentage for all of the transactions in this group.(USRCPUT)
Dispatch Delays First Disp - This shows the first dispatch delay in ms.(DSPDELAY)
Dispatch Delays Other - This shows waits that are not part of the first dispatch delay or I/O delay.
Dispatch Delays I/O Wait - This shows delays that are I/O related (see ZOSCIX4 below).
Uncapt Wait - This shows uncaptured wait; SUSPTIME - (I/O Waits + DSPDELAY + DISPWTT).
CPU Disp Ratio - This shows the ratio of CPU time to Dispatch time ((USRCPUT / USRDISPT)*100).
ZOSCIX3 - Shows information about the CICS transaction waits.
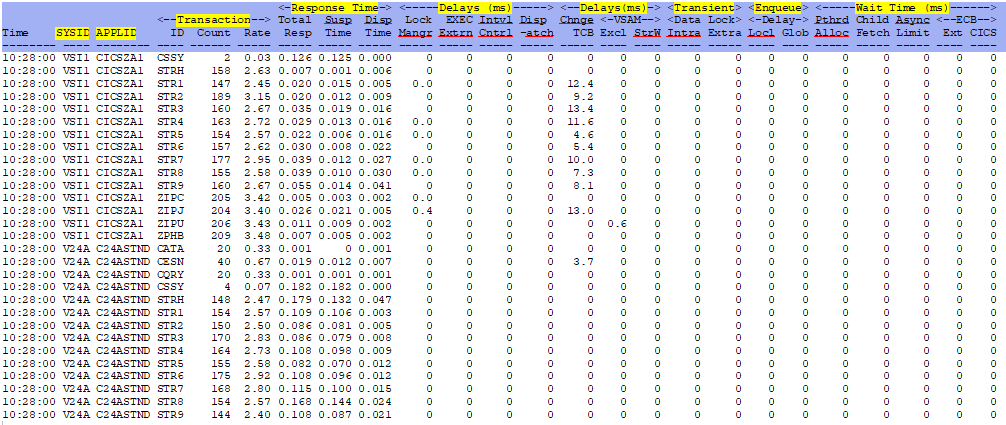
SYSID - This shows the system ID on which CICS is running.(SMFMNSID)
APPLID - This shows the application ID of the CICS Region.(SMFMNSPN)
Tran ID - This shows the transaction identifier.(TRAN)
Count - This shows the number of terminated transactions for the interval.
Rate - This shows the rate per second of terminated transactions for the interval.
Response Time Total Resp - This shows the response time of the transactions for the interval. Response time
is calculated from transaction stop time
minus transaction start time.(STOP-START) Transaction response time is made up of
Suspend Time + Dispatch Time.
Response Time Susp Time - This shows the average suspend time of the transactions for the interval.
(SUSPTIME)
Response Time Disp Time - This shows the dispatch time of the transactions for the interval.
(USRDISPT)
Delays Lock Mangr - This shows the elapsed time that the user task waited to acquire a lock on a resource.
A user task cannot explicitly acquire
a lock on a resource, but many CICS modules lock resources on behalf of user tasks
using the CICS lock manager (LM) domain (LMDELAY).
Delays EXEC Extrn - This shows the elapsed time that the user task waited for one or more ECBs passed to CICS
by the user task using the EXEC CICS WAIT EXTERNAL ECBLIST
command to be posted by the MVS POST command (WTEXWAIT).
Delays Intvl Cntrl - This shows the elapsed time that the user task waited as a result of issuing one of the
following commands: EXEC CICS DELAY for a specified
time interval or for a specified time of day to expire; EXEC CICS RETRIEVE with the WAIT
option specified (ICDELAY).
Delays Dispatch - This shows the elapsed time that the user task waited as a result of giving up control to
another task by using SUSPEND, CHANGE TASK PRIORITY,
DELAY, POST, PERFORM RESETTIME or START TRANSID with the ATTACH option.(GVUPWAIT)
Delays Change TCB - This shows the elapsed time that the user task waited for redispatch after a CICS Dispatcher
change-TCB mode request was issued by or on
on behalf of the user task. IE a change-TCB mode request from a CICS L8 or S8 mode
TCB back to the CICS QR mode TCB might have to wait for the QR TCB because
another task is currently dispatched on the QR TCB.(DSCHMDLY)
Delays VSAM Excl - This shows the elapsed time in which the user task waited for exclusive control of a VSAM
Control Interval.(FCXCWTT)
Delays VSAM StrW - This shows the elapsed time in which the user task waited for a VSAM string.(FCVSWTT)
Transient Data Lock Intra - This shows the intrapartition lock wait time in ms/transaction.(TDILWTT)
Transient Data Lock Extra - This shows the extrapartition lock wait time in ms/transaction.(TDELWTT)
Enqueue Delay Locl - This shows the local enqueue delay time in ms/transaction.(ENQDELAY)
Enqueue Delay Glob - This shows the global enqueue delay time in ms/transaction.(GNQDELAY)
Wait Time Pthrd Alloc - This shows the time the transaction had to wait for a Liberty pthread to be
allocated for links to Liberty programs.(DSAPTHWT)
Wait Time Child Fetch - This shows the wait time for a child task as the result of a CICS FETCH CHILD/ANY
command which was not completed.(ASFTCHWT)
Wait Time Async Limit - This shows the time that the user task was delayed as a result of asynchronous child
task limits managed by the asynchronous services domain.(ASRNATWT)
Wait Time ECB Ext - This shows the EXEC CICS WAIT EXTERNAL time.(WTEXWAIT)
Wait Time ECB CICS - This shows the EXEC CICS WAITCICS and WAIT EVENT time.(WTCEWAIT)
ZOSCIX4 - Shows detailed information about the CICS transactions
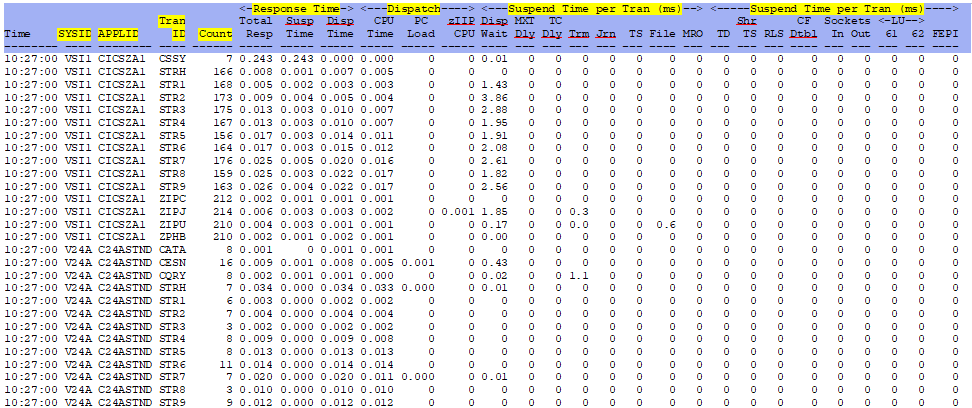
SYSID - This shows the system ID on which CICS is running.(SMFMNSID)
APPLID - This shows the application ID of the CICS Region.(SMFMNSPN)
Tran ID - This shows the transaction identifier.(TRAN)
Count - This shows the number of terminated transactions for the interval.
Response Time Total Resp - This shows the response time of the transactions for the interval. Response time
is calculated from transaction stop time
minus transaction start time.(STOP-START) Transaction response time is made up of
Suspend Time + Dispatch Time.
Response Time Susp Time - This shows the average suspend time of the transactions for the interval.
(SUSPTIME)
Response Time Disp Time - This shows the dispatch time of the transactions for the interval.
(USRDISPT)
Dispatch CPU Time - This shows the average CPU time of the transactions for the interval.(USRCPUT)
Dispatch PC Load - This shows the average time used to load programs into storage for the interval.
(PCLOADTM)
Dispatch zIIP CPU - This shows the average CPU time the transaction spent running on a zIIP processor.
(USRCPUT-CPUTONCP) This value is a component of CPU time.
Suspend Time per Tran (ms) Disp Wait - This shows the elapsed time for which the user task waited for redispatch.
This time is the aggregate of the wait times
between each event completion and user-task redispatch.(DISPWTT)
Suspend Time per Tran (ms) MXT Dly - This shows the elapsed time waiting for the first dispatch, which was
delayed because of the limits set by the system
parameter (MXT) being reached.(MXTDELAY)
Suspend Time per Tran (ms) TC Dly - This shows the elapsed time waiting for the first dispatch, which was
delayed because of the limits set for the
transaction class of this transaction being reached.
Suspend Time per Tran (ms) Trm - This shows the elapsed time for which the user task waited for input from the
terminal operator after issuing a RECEIVE request.(TCIOWTT)
Suspend Time per Tran (ms) Jrn - This shows the elapsed time for which the user task waited for journal
(logstream) I/O.(JCIOWTT)
Suspend Time per Tran (ms) TS - This shows the elapsed time for which the user task waited for VSAM temporary
storage.(TSIOWTT)
Suspend Time per Tran (ms) File - This shows the elapsed time for which the user task waited for file I/O.
(FCIOWTT)
Suspend Time per Tran (ms) MRO - This shows the elapsed time for which the user task waited for control at this
end of an MRO link.(IRIOWTT)
Suspend Time per Tran (ms) TD - This shows the elapsed time for which the user task waited for VSAM transient
data.(TDIOWTT)
Suspend Time per Tran (ms) Shr TS - This shows the elapsed time for which the user task waited for an
asynchronous shared temporary storage request to a temporary
storage data server to complete.(TSSHWAIT)
Suspend Time per Tran (ms) RLS - This shows the elapsed time for which the user task waited for RLS file I/O.
(RLSWAIT)
Suspend Time per Tran (ms) CF Dtbl - This shows the elapsed time for which the user task waited for a data
table access request to the Coupling Facility Data
Table server to complete.(CFDTWAIT)
Suspend Time per Tran (ms) Sockets In - This shows the elapsed time for which the user task waited for
inbound socket I/O.(SOIOWTT)
Suspend Time per Tran (ms) Sockets Out - This shows the elapsed time for which the user task waited for
outbound socket I/O.(SOOIOWTT)
Suspend Time per Tran (ms) LU 61 - This shows the elapsed time for which the user task waited for I/O on a
LUTYPE6.1 connection or session.(LU61WTT)
Suspend Time per Tran (ms) LU 62 - This shows the elapsed time for which the user task waited for I/O on a
LUTYPE6.2 (APPC) connection or session.(LU62WTT)
Suspend Time per Tran (ms) FEPI - This shows the elapsed time for which the user task waited for all FEPI
services.(SZWAIT)
Back to top of page
Back to Performance Tuning Guide

