z/OS CPU Analysis
z/OS CPU - Best Practices
Helpful information:
The information below is shown in real time monitor screens. The same information is also shown in 15 minute increments
and daily totals in reports. Both are helpful in problem determination and trending analysis.
Helpful ESAMON screens/ESAMAP reports:
- ZOSCEC - z/OS CEC Detail - Shows processor counts and utilization by processor type.
- ZOSCPU - z/OS CPU Report - Shows CPU utilization and other general information per logical processor.
- ZOSJACC - z/OS Job/Step CPU Accounting Report - Shows detailed CPU usage, detailed Service unit rates and Storage
(memory) usage by Jobname, JES Identifier and Service Class in CPU seconds.
- ZOSJCPU - z/OS Job/Step CPU/Resoure Analysis - Shows the same as ZOSJACC in CPU percentages plus more Storage (memory)
information.
Using zVPS to find information for solving issues with the z/OS CPU:
ZOSCEC - Shows information about the z/OS CEC.

Serial - This shows the CPU serial number (SMF70SER).
Processors Type - This shows the processor type (SMF70CIN).
Processors Cnt - This shows the number of processors (SMF70CTN).
Processors DED - This shows the number of dedicated processors (SMF70BPS).
Processors VCPU - This shows the number of logical processors defined.
Utilization Totall - This shows the total processor utilization (SMF70PDT).
Utilization Logical - This shows the logical processor utilization - percent of time a physical
processor was assigned to this logical processor (SMF70EDT).
Central Stg (GB) - This shows the total gigabytes of central memory (SMF70SER).
Note: Clicking on a Processor line (zview) or zoom (z/VM) will show the ZOSLPARS screen - LPAR Summary Analysis.
ZOSCPU - Shows information about the z/OS CPU Utilization. This example shows both the 'current' data on the
ZOSCPU zMON screen and an example of how the data is summarized into
15 minute intervals (not shown) and for the day (shown) in the zMAP report.
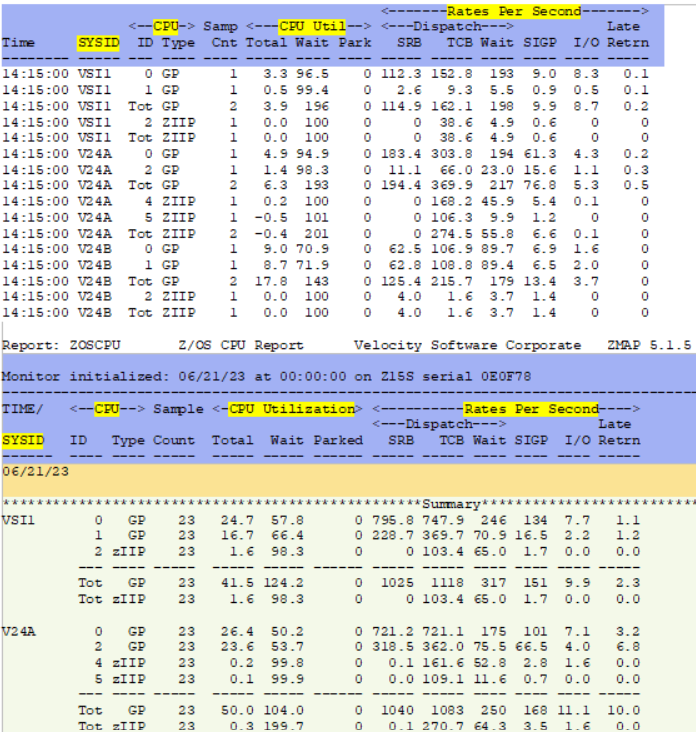
SYSID - This shows the system name as defined in the parmlib member IEASYSxx SYSNAME (SMF70SNM).
CPU ID - This shows the CPU logical processor ID (Tot for total) (SMF70CID).
CPU Type - This shows the CPU logical processor type (GP/IFL/ZIIP/etc) (SMF70TYP).
CPU Util Total - This shows the total CPU utilization (if on an LPAR - zero if under z/VM)
(SMF70EDT).
CPU Util Wait - This shows the CPU serial number (SMF70SER).
CPU Util Park - This shows the CPU serial number (SMF70SER).
Rates per Second SRB - This shows the SRB dispatch rate per second (SMF70SRB).
Rates per Second TCB - This shows the TCB dispatch rate per second (SMF70TCB).
Rates per Second Wait - This shows the Wait dispatch rate per second (SMF70WTD).
Rates per Second SIGP - This shows the Signal processor rate per second (SMF70SIG).
Rates per Second I/O - This shows the I/O rate per second (SMF70NIO).
Rates per Second Late Retrn - This shows the number of times PR/SM issued a warning-track interruption to a
logical processor and z/OS was unable to return the logical processor within the grace period. (SMF70WTU).
ZOSJACC - Shows information about the z/OS Job/Step CPU use, service unit rates and memory in CPU seconds.
(Picture highlights one system completely, totals only shown for the other two systems)
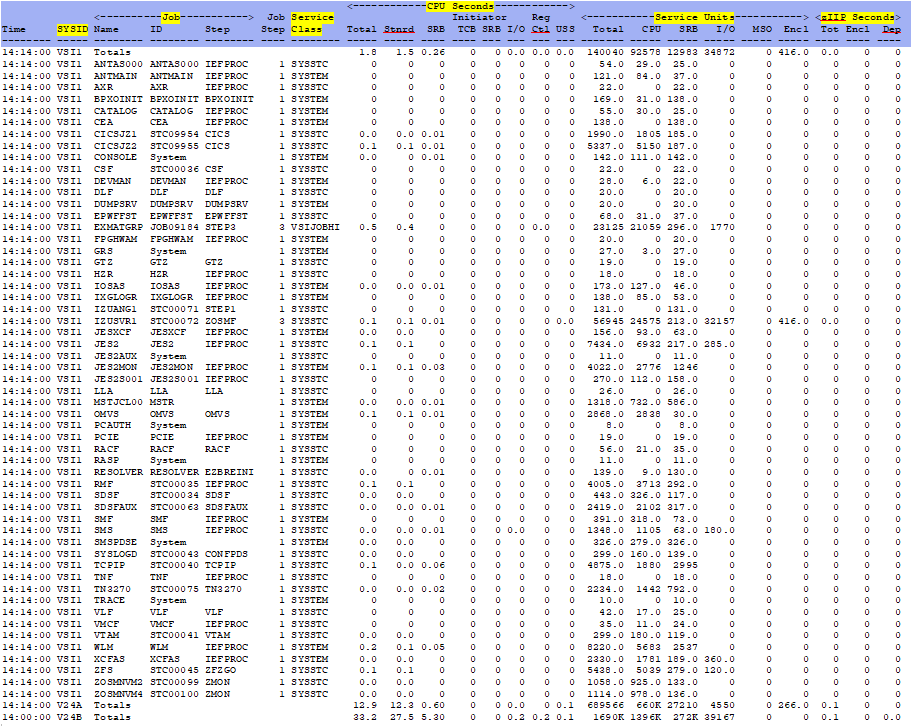
SYSID - This shows the system name as defined in the parmlib member IEASYSxx SYSNAME (SMF70SNM).
Job Name - This shows the job name.(SMF30JBN)
Job ID - This shows the JES job identifier.(SMF30JNM)
Job Step - This shows the job step name.(SMF30STM)
Service Class - This shows the service class name.(SMF30SCN)
CPU Seconds Total - This shows the total CPU seconds - including all of the CPU Seconds components.
CPU Seconds Stnrd - This shows the seconds of standard CPU step time - includes enclave, preempt-able, client
SRB time and ZIIP eligible
work running on a GP.(SMF30CPT)
CPU Seconds SRB - This shows the seconds of CPU running under SRB.(SMF30CPS)
CPU Seconds Initiator TCB - This shows the seconds of initiator CPU running under TCB.(SMF30ICU)
CPU Seconds Initiator SRB - This shows the seconds of initiator CPU running under SRB.(SMF30ISB)
CPU Seconds I/O - This shows the seconds of CPU used to process I/O interrupts.(SMF30IO)
CPU Seconds Reg Ctl - This shows the seconds of CPU used by the region control task.(SMF30RCT)
CPU Seconds USS - This shows the seconds of CPU used by the UNIX System Services (includes standard CPU and
SRB times).(SMF30OST)
Service Units Total - This shows the total service units.(SMF30SRV)
Service Units CPU - This shows the CPU service units.(SMF30CSU)
Service Units SRB - This shows the SRB service units.(SMF30SRB)
Service Units I/O - This shows the I/O service units.(SMF30IO)
Service Units MSO - This shows the main memory occupancy service units.(SMF30MSO)
Service Units Enclv - This shows the independent enclave CPU service units.(SMF30ESU)
zIIP Seconds Total - This shows the seconds of general CPU on the zIIP, including enclave.
(SMF30_TIME_ON_zIIP)
zIIP Seconds Encl - This shows the seconds of enclave CPU on the zIIP.(SMF30_ENCLAVE_TIME_ON_zIIP)
zIIP Seconds Dep - This shows the seconds of dependent enclave CPU on the zIIP.(SMF30_DEPENC_TIME_ON_zIIP)
ZOSJCPU - Shows information about the z/OS Job/Step CPU use, service unit rates and memory in CPU percentages.
(Picture highlights one system completely, totals only shown for the other two systems)
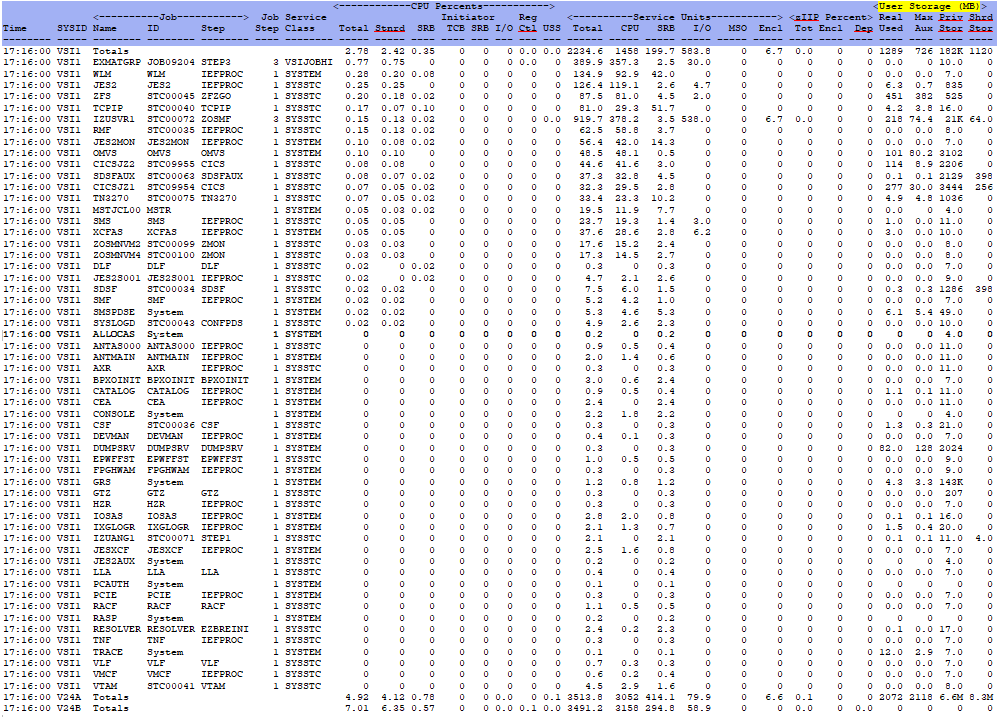
SYSID - This shows the system name as defined in the parmlib member IEASYSxx SYSNAME (SMF70SNM).
Job Name - This shows the job name.(SMF30JBN)
Job ID - This shows the JES job identifier.(SMF30JNM)
CPU Percents Total - This shows the total CPU utilization - including all of the CPU Percents components.
CPU Percents Stnrd - This shows the percent of standard CPU step time - includes enclave, preempt-able, client
SRB time and ZIIP eligible
work running on a GP.(SMF30CPT)
CPU Percents SRB - This shows the percent of CPU running under SRB.(SMF30CPS)
CPU Percents Initiator TCB - This shows the percent of initiator CPU running under TCB.(SMF30ICU)
CPU Percents Initiator SRB - This shows the percent of initiator CPU running under SRB.(SMF30ISB)
CPU Percents I/O - This shows the percent of CPU used to process I/O interrupts.(SMF30IO)
CPU Percents Reg Ctl - This shows the percent of CPU used by the region control task.(SMF30RCT)
CPU Percents USS - This shows the percent of CPU used by the UNIX System Services (includes standard CPU and
SRB times).(SMF30OST)
User Storage - Real Used - This shows the high water mark of real memory used to back 64-bit private memory.
(SMF30HVR/256)
User Storage - Max Aux - This shows the high water mark of auxiliary memory used to back 64-bit private memory.
(SMF30HVA/256)
User Storage - Priv Stor - This shows the amount of 64-bit private memory obtained by this step or job, including
guarded virtual memory.(SMF30HVO/1024/1024)
User Storage - Shar Stor - This shows the amount of 64-bit shared memory this step/job has access or
addressability.(SMF30HSO/1024/1024)
Back to top of page
Back to Performance Tuning Guide

