DB2 Resource Analysis
z/OS Db2 Resources - Best Practices
Helpful information:
- Fields come from SMF records:
- ZOSDB2B - SMF 100 IFCID 2 - DSECT DSNDQBST
- ZOSDB2D - SMF 100 IFCID 1 - DSECT DSNDQISE
- ZOSDB2S1 - SMF 100 IFCID 225 - DSECT QW0225 - member DSNDQW03
- ZOSDB2S2 - SMF 100 IFCID 225 - DSECT QW0225 - member DSNDQW03
- Field names are noted in parenthesis after the description.
Helpful ESAMON screens/ESAMAP reports:
- ZOSDB2B - Db2 Buffer Analysis - This shows information about Db2 buffers.
- ZOSDB2D - Db2 EDM Pool Statistics - This shows information about the DB2 Environmental Descriptor Manager (EDM) pools.
- ZOSDB2S1 - Db2 Low Storage Analysis - This shows information about Db2 memory.
- ZOSDB2S2 - Db2 High Storage Analysis - This shows more information about Db2 memory.
Using zVPS to find information for solving issues with the DB2 Resources:
ZOSDB2B - Shows information about Db2 buffers.
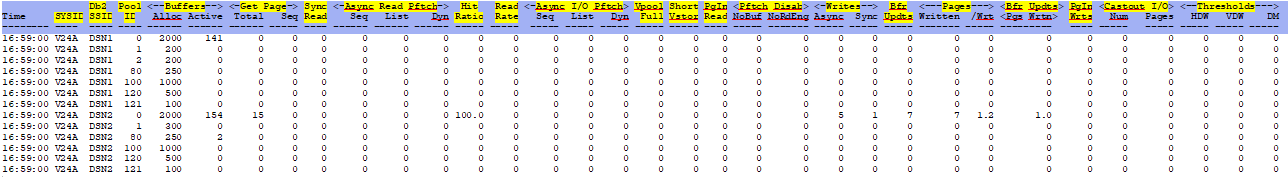
SYSID - This shows the system name as defined in the parmlib member IEASYSxx SYSNAME.(SMF30SID)
DB2 SSID - This shows the Db2 subsystem identifier.
Pool ID - This shows the Db2 buffer pool ID.(QBSTPID)
Buffers Alloc - This shows the number of buffers allocated to this pool.(QBSTVPL)
Buffers Active - This shows the number of currently active buffers in this pool.(QBSTCBA)
Get Page Total - This shows the number of get page requests, including conditional, non-conditional,
successful and unsuccessful requests.
Get Page Seq - This shows the number of get page requests for sequential access.(QBSTSGT)
Sync Read - This shows the number of synchronous read I/Os.(QBSTRIO)
Async Read Pftch Seq - This shows the number of asynchronous read I/O's using sequential prefetch.(QBSTSPP)
Async Read Pftch List - This shows the number of asynchronous read I/O's using list prefetch.(QBSTLPP)
Async Read Pftch Dyn - This shows the number of asynchronous read I/O's using dynamic prefetch.(QBSTDPP)
Hit Ratio - This shows the buffer efficiency expressed as a percentage calculated with the formula:
((QBSTGET - (QBSTRIO + QBSTSPP + QBSTLPP + QBSTDPP)) / QBSTGET) * 100.
When the hit ratio is negative, it means that prefetch has brought pages into the
buffer pool that are not subsequently referenced, either because the query stops before it reaches the end of
the table space, or because the prefetched pages are stolen by Db2 for reuse before
the query can access them.
The hit ratio measurement becomes less meaningful if the buffer pool
is used by additional processes, such as utilities or work files.
Read Rate - This shows the number of I/O's expressed as a rate calculated with the formula:
((QBSTRIO + QBSTPIO + QBSTLIO + QBSTDIO) / Interval Time)
Async I/O Pftch Seq - This shows the number of pages read asynchronously using sequential prefetch.(QBSTPIO)
Async I/O Pftch List - This shows the number of pages read asynchronously using list prefetch.(QBSTPIO)
Async I/O Pftch Dynt - This shows the number of pages read asynchronously using dynamic prefetch.(QBSTPIO)
Vpool Full - This shows the number of getpage failures due to the buffer being full.(QBSTXFL)
Short Vstor - This shows the number of expansion failures due to insufficient memory.(QBSTXFV)
PgIn Read - This shows the number of page-ins required for read I/O.(QBSTRPI)
Pftch Disab NoBuf - This shows the number of times prefetch was disabled due to unavailable buffer
resources.(QBSTSPD)
Pftch Disab NoRdEng - This shows the number of times prefetch was disabled due to unavailable read engine.
(QBSTREE)
Writes Async - This shows the number of asynchronous write I/O's.(QBSTWIO)
Writes Sync - This shows the number of synchronous write I/O's (immediate writes).(QBSTIMW)
Bfr Updts - This shows the number of times buffer updates were requested against pages in the buffer pool.
(QBSTSWS)
Pages Written - This shows the number of pages from the buffer pool written to DASD.(QBSTPWS)
Pages /Wrt - This shows the number of pages written per I/O caculated with the formula:
(QBSTPWS / QBSTWIO + QBSTIMW)
Bfr Updts Pgs Wrtn - This shows the number of buffer updates per page written caculated with the formula:
(QBSTSWS / QBSTPWS)
PgIn Wrts - This shows the number of page ins required for a write I/O.(QBSTWPI)
Castout I/O Num - This shows the number of castout I/O's.(QBSTCIO)
Castout I/O Pages - This shows the number of pages written per castout I/O.(QBSTPCO)
Thresholds HDW - This shows the number of times deferred write threshold reached.(QBSTDWT)
Thresholds VDW - This shows the number of times vertical deferred write threshold reached.(QBSTDWV)
Thresholds DM - This shows the number of times data manager critical threshold reached.(QBSTDMC)
ZOSDB2D - Shows information about the EDM pools.
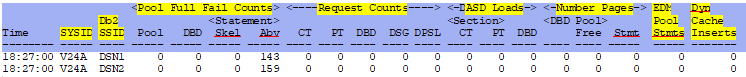
SYSID - This shows the z/OS system ID of system being reported.
DB2 SSID - This shows the Db2 subsystem identifier.
Pool Full Fail Counts Pool - This shows the fail due to pool full.(QISEFAIL)
Pool Full Fail Counts DBD - This shows the fail due to DBD pool full.(QISEDFAL)
Pool Full Fail Counts Skel - This shows the fail due to statement skeleton pool full.(QISEKFAL)
Pool Full Fail Counts Abv - This shows the fail due to statement above pool full.(QISESFAL)
Request Counts CT - This shows the number of requests for CT sections.(QISECTG)
Request Counts PT - This shows the number of requests for PT sections.(QISEKTG)
Request Counts DBD - This shows the number of requests for DBD sections.(QISEDBDG)
Request Counts DSG - This shows the number of requests for dynamic cache.(QISEDSG)
Request Counts DPSL - This shows the number of requests for look for DPS.(QISEDPSL)
DASD Loads Section CT - This shows the number of load CT sections from DASD.(QISECTL)
DASD Loads Section PT - This shows the number of load PT sections from DASD.(QISEKTL)
DASD Loads DBD - This shows the number of loading DBD from DASD.(QISEDBDL)
Number Pages DBD Pool - This shows the number of pages in the DBD Pool.(QISEDPGE)
Number Pages DBD Pool Free - This shows the number of free pages in the DBD free chain.(QISEDFRE)
Number Pages DBD Pool Stmt - This shows the number of used pages in the DBD pool.(QISEDYNP)
EDM Pool Stmts - This shows the number of statements in the EDM Pool.(QISESTMT)
Dyn Cache Inserts - This shows the number of inserts for dynamic cache.(QISEDSI)
ZOSDB2S1 - Shows information about low memory.
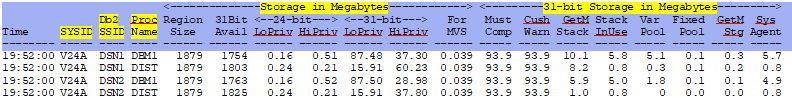
SYSID - This shows the z/OS system ID of system being reported.
DB2 SSID - This shows the DB2 subsystem identifier.
Proc Name - This shows the procedure name of the corresponding address space (this name will either be
DBM1 or DIST).(QW0225AN)
Storage in MB Region Size - This shows the size of the corresponding region.(QW0225RG)
Storage in MB 31Bit Avail - This shows the amount of available 31-bit memory.(QW0225AV)
Storage in MB 24 bit LoPriv - This shows the 24-bit low private.(QW0225LO)
Storage in MB 24 bit HiPriv - This shows the 24-bit high private.(QW0225HI)
Storage in MB 31 bit LoPriv - This shows the 31-bit low private.(QW0225EL)
Storage in MB 31 bit HiPriv - This shows the 31-bit high private.(QW0225EH)
Storage in MB For MVS - This shows the 31-bit storage reserved for MVS.(QW0225MV)
31-bit Storage in MB Must Comp - This shows the 31-bit memory reserved for must complete.(QW0225CR)
31-bit Storage in MB Cush Warn - This shows the memory cushion warning to contract.(QW0225SO)
31-bit Storage in MB GetM Stack - This shows the 31-bit getmained stack.(QW0225GS)
31-bit Storage in MB Stack InUse - This shows the 31-bit stack in use.(QW0225SU)
31-bit Storage in MB Var Pool - This shows the 31-bit variable pool memory (QW0225VR)
31-bit Storage in MB Fixed Pool - This shows the 31-bit fixed pool memory (QW0225FX)
31-bit Storage in MB GetM Stg - This shows the 31-bit getmained memory (QW0225GM)
31-bit Storage in MB Sys Agent - This shows the 31-bit stack in use for system agents (a subset of QW0225SU).
(QW0225SS)
ZOSDB2S2 - Shows information about low memory.
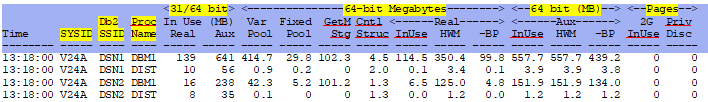
SYSID - This shows the z/OS system ID of system being reported.
DB2 SSID - This shows the DB2 subsystem identifier.
Proc Name - This shows the procedure name of the corresponding address space (this name will either be
DBM1 or DIST).(QW0225AN)
31/64 bit In Use Real - This shows the size of the corresponding region.
31/64 bit Aux - This shows .
64 bit MB Var Pool - This shows .
64 bit MB Fixed Pool - This shows .
64 bit MB GetM Stg - This shows .
64 bit MB Cntl Struc - This shows .
64 bit MB Real InUse - This shows .
64 bit MB Real HWM - This shows .
64 bit MB Real BP - This shows .
64 bit MB Aux InUse - This shows .
64 bit MB Aux HWM - This shows .
64 bit MB Aux BP - This shows .
Pages 2G InUse - This shows .
Pages 2G Priv Disc - This shows .
Back to top of page
Back to Performance Tuning Guide

