
The CPU - is the highest level of measurement in z/VM.
- CPU response time is a function of processor speed and number of CPUs. If there are issues with the CPU
utilization, it will be one of the first things to be seen.
It is key to know the baseline numbers of your environment to be able to see when abnormalities appear. - Sometimes looking at the utilization numbers can be misleading especially in a Linux environment. zVPS measures
impacts in CPU seconds from the hardware.
It measures the impacts of LPAR(s), z/VM virtual machines, Linux processes, zVSE jobs/partitions, etc. This gives a very accurate measurement of the system. - In a z/VM MP environment, adding processors can reduce queuing time and increase availability
but it also costs money.
For example, Linux should not have multiple processors when the workload doesn't need it. An extra virtual processor when not necessary, can result in spin locks. Spin locks cause excessive overhead when not essential. Also, if the share of the server doesn't change, extra unneeded vCPUs will make all the vCPUs run slower. - Minimizing polling is another action that can reduce CPU requirements. Linux hertz time is just one example of
polling within a Linux server. This can and should be corrected using the timer patch.
Note that WAS, Domino, SAP and some other applications have since implemented polling. - Watch for master processor bottlenecks:
- Pay attention to which processor is the master processor.
- The master runs processes that need synchronization and consistency or code that was not written for multi-processing. These include RACF, Spooling, IUCV, Paging, CP commands, the CP monitor and linemode commands like screen scraping.
- If the master processor is overloaded, move the workload or add another PHYSICAL (not virtual) processor.
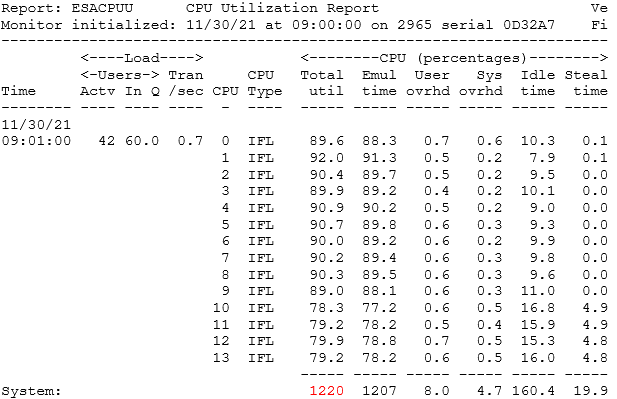
- Watch ESACPUU (system/user overhead), ESAXACT (simulation wait), ESALPAR (master engine with weighting) and ESAPLDV.
- IF THE MASTER PROCESSOR IS OVERLOADED - ADDING ANOTHER ENGINE WILL NOT HELP - IT WILL ADD TO THE PROBLEM.
A second LPAR will need to be added so there is a second master processor. - Affinity processing is the concept that because all information for an instruction needs to be in L1 cache before it can execute, a virtual CPU will try first to be dispatched on the same thread/CPU to reduce the need to move data into L1 cache. However, with the way z/VM server systems (Linux...) tend to poll, this doesn't tend to work. The cache gets polluted very quickly, especially for high I/O systems such as TPF. See the SYSCONTROL command below to adjust affinity when running these types of systems.
- The Dispatch Time Slice controls the maximum amount of time a vCPU can continously run on a real processor. It defaults to 5ms with SMT off or 10ms with SMT on. Per Velocity Software, the dispatch time slice should be set to 1. See helpful settings below to adjust this to match your environment.
- CPU overcommit refers to allocating more vCPUs to servers than the number of available physical CPU cores on the LPAR. The overcommit ratio should not exceed 2:1.
- If seeing available CPU capacity (ESALPARS/ESACPUU) AND CPU wait (on ESAXACT) - use the SYSCONTROL command below.
- What is right for your environment depends on reviewing the current environment using
the zVPS tools/information to gain an understanding of what improvements or corrections are possible.
Again, it is incredibly helpful to know your baseline environment then abnormalities become more obvious and easier to find. - Processor Utilization Components:
- LPAR Level:
- LPAR Physical Overhead
- LPAR Assigned Time - Overhead
- LPAR Assigned Time - Virtual
- z/VM Level: (From - LPAR Assigned time - Virtual)
- System Time (z/VM Control Program)
- User Overhead (Allocated System Time)
- Emulation (z/VM Guest Time)
- Linux Level: (From - Emulation - z/VM Guest Time)
- System Time (kernel Time)
- IRQ Time
- User Time ("Real Application Work")
- Idle Time
- When looking at CPU utilization and capacity, use this hierarchy:
- CEC Utilization (Capacity Planning - ESALPAR/ESALPARS)
- LPAR Weights (Entitlement - ESALPAR)
- LPAR Utilization vs Entitlement (ESALPAR)
- Virtual Machine Setting (Share - ESAUSRC/ESASRVC/ESAUSP2)
- Virtual CPU Share (ESACPUU/ESACPUA)
- Linux Process "niced" (ESALNXC/ESALNXP)
- Workload Requirements
- When looking at CPU wait issues, use this hierarchy:
- Configuration issues - How busy is the CEC? How much does the LPAR in question have entitled, is it enough? (ESALPAR)
- Capacity issues - Is the CEC/LPAR running at high capacity? (ESALPAR)
- Linux configuration issues -
- Spin locks, where one vCPU waits for a lock held on another vCPU (ESACPUA/ESALCK)
- Linux overhead managing vCPUs (ESALNXP/ESALNXS)
- z/VM overhead managing vCPUs (ESALPAR/ESACPUA/ESACPUU)
- Hardware cache pollution (ESAMFC/ESAMFCA/ESADSD5)
- Valid shares per vCPU (ESAUSRC/ESAUSCP)
Some clarification on CPU naming:
- The machine is equipped with physical cores - not engines, not processors, not CPUs, not IFLs, not CPs.
- Cores, whether physical or logical, come in different types: CP, IFL, etc. Logical cores and physical cores have a percent-busy metric called core utilization.
- For a logical core - this is the percent of time the logical core is dispatched on a physical core.
- For a physical core, this is the percent of time the physical core has a logical core dispatched upon it.
- Contained within a core, either physical or logical, are instruction execution units called processors. Physical cores contain physical processors. Logical cores contain logical processors.
- An IFL core-type can have either one or two processors contained in the core, depending upon the SMT level. SMT-2 has two processors in the core.
- Logical processors have a percent-busy metric called processor utilization. This is the percent of elapsed time the processor has a non-wait PSW loaded (this hasn't changed).
- Synonymous with processor utilization is processor busy, processor load, CPU utilization, CPU load and CPU busy.
- Keep in mind, you pay for physical cores (not threads or logical cores/processors - which gets confusing with SMT).
Presentations about the CPU environment and utilization:
Processor Configuration and Analysis Intro
Processor Advanced Topics
Helpful system settings:
- SET SRM DSPSlice minslice -
For Linux workloads, the default of 5 (ms) may be too high. Start by setting it to 3 (ms) then go down to 1 (ms).
This helps servers running online transactions. To keep this setting over an IPL, update the SYSTEM CONFIG.
Note: when turning on SMT, the dispatch time slice default goes to 10 and should be lowered if running servers that do online transactions. Also, when setting MODLEVEL 0 (below), the dispatch time slice goes back to 5. Check the current DSPSLICE setting before setting the MODLEVEL. - Check/Update SYSCONTROL:
q syscontrol - (with a default MODLEVEL of 1):
DISPATCH THDAFFINITY       ON
DISPATCH PREEMPTLOCAL     OFF
DISPATCH TSEARLY           50
DISPATCH INCHIPBUSY     50000  <-- Delay for steal on chip
DISPATCH INCHIPDELAY    50000
DISPATCH INNODEBUSY    100000  <-- Delay for steal on node
DISPATCH INNODEDELAY   100000
DISPATCH INSYSBUSY     200000  <-- Delay for steal on system
DISPATCH INSYSDELAY    200000
It will allow available capacity to be used immediately instead of waiting for the dispatch delay. This also helps alleviate "steal time" for Linux. (Set it back to 1 to return to the original default setting).
q syscontrol - (with MODLEVEL 0):
DISPATCH THDAFFINITY      OFF
DISPATCH PREEMPTLOCAL      ON
DISPATCH TSEARLY            0
DISPATCH INCHIPBUSY         0
DISPATCH INCHIPDELAY        0
DISPATCH INNODEBUSY    100000
DISPATCH INNODEDELAY   100000
DISPATCH INSYSBUSY     200000
DISPATCH INSYSDELAY    200000
q syscontrol - (with all settings at 0):
DISPATCH THDAFFINITY      OFF
DISPATCH PREEMPTLOCAL      ON
DISPATCH TSEARLY            0
DISPATCH INCHIPBUSY         0
DISPATCH INCHIPDELAY        0
DISPATCH INNODEBUSY         0
DISPATCH INNODEDELAY        0
DISPATCH INSYSBUSY          0
DISPATCH INSYSDELAY         0
Settings that are no longer relevant/useful:
- SET SRM DSPBUF | LDUBUF | STORBUF
- SET SRM IABIAS
- SET SRM MAXWSS
Understanding how to view CPU utilization with SMT
Helpful ESAMON screens/ESAMAP reports:
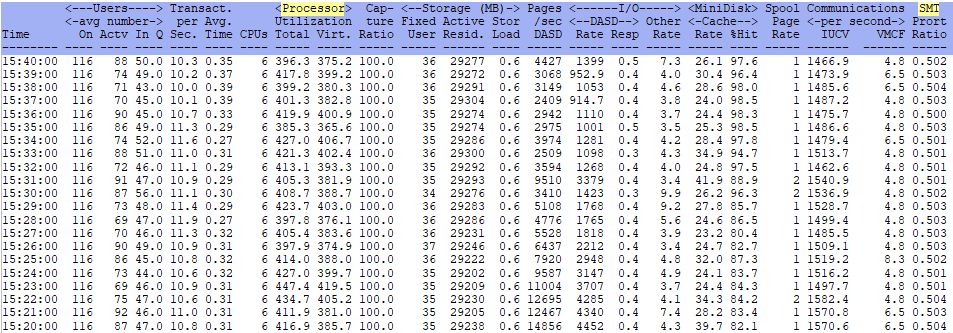
- ESAMAIN - System overview - shows current total CPU processor utilization
- ESACPUU - CPU Utilization Analysis (Part1) - shows current CPU processor utilization details
- ESACPUA - CPU Utilization Analysis (Part2) - shows more current CPU processor utilization details
- ESAMFC - Processor Cache Analysis - See Understanding MFC Data
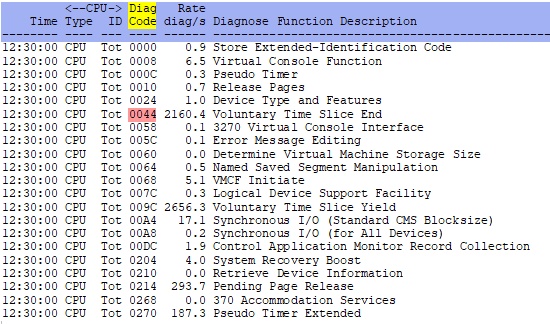
- ESADIAG - Diagnose code rate - shows information on which diagnose codes are being used at what rate
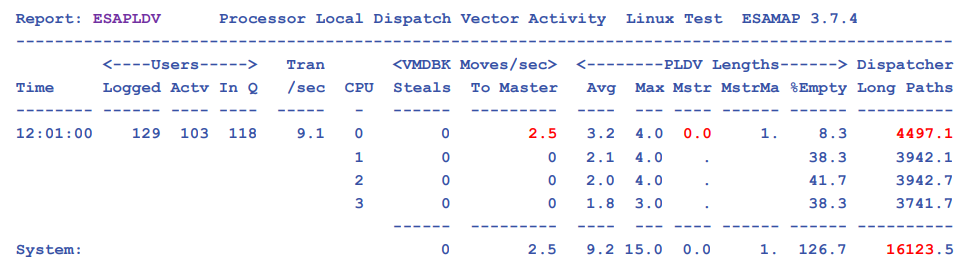
- ESAPLDV - Processor Local Dispatch Vector Activity - shows z/VM Dispatcher information
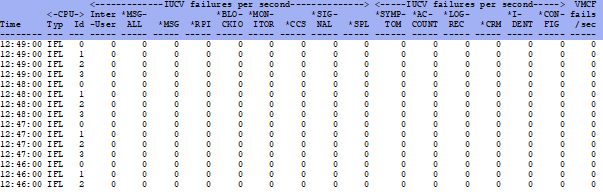
- ESAIUER - IUCV error analysis - shows errors in inter-system communication
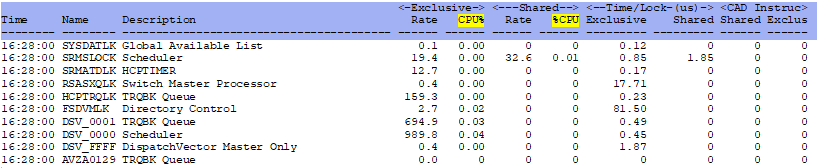
- ESALCK - Spin lock activity - shows where spin locks are happening
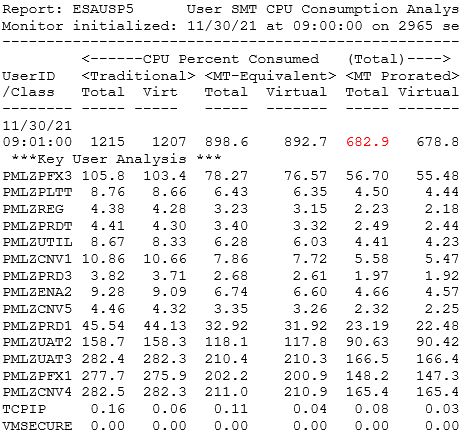
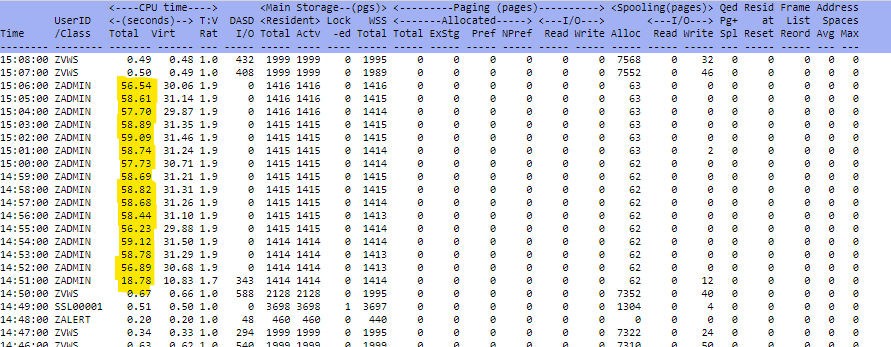
- ESATOPU - Top Users Resource Use - shows Top users for last 30 minutes
Using zVPS to find information for solving issues with the CPU utilization:
Use zVPS real time monitoring and daily reports to see how efficiently the environment is running.
What is the total CPU utilization?
How is that broken down by LPARs/IFLs?
What are the users consuming? What else might be happening? Here are some places to start:
ESAMAIN - System overview information:
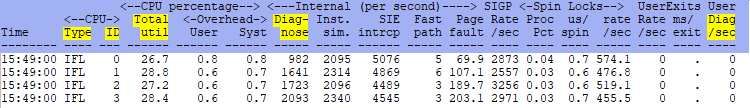
ESACPUU - Shows information for each CPU/engine on the box.
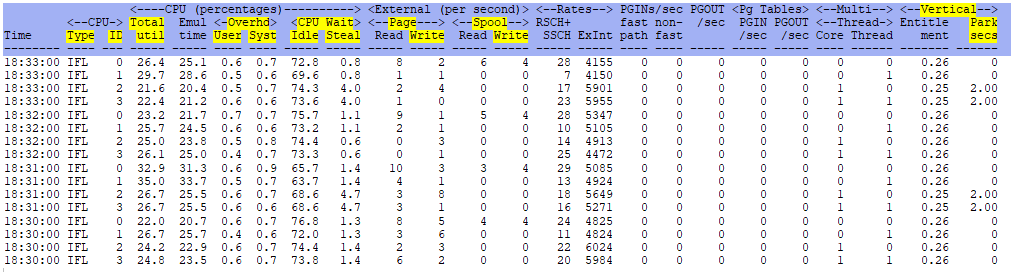
ESACPUA - Shows similar information as ESACPUU.
ESADIAG - Shows Diagnose rates.
ESAPLDV - Shows Processor Local Dispatch Vector.
ESAIUER - Shows IUCV errors.
ESALCK - Shows spin lock activity.
ESATOPU - Shows CPU utilization by user - top users first.
Conclusions:
Looking at CPU utilization is one of the quickest ways to find processing issues.
Just like on the freeway:
- Sometimes it is just one car (out of control user/system)
- Sometimes additional lanes or further tuning can be needed (CPU utilization stays high or spikes frequently)
- Sometimes the lanes are clogged by an accident (not a CPU problem, but other hardware issues).
The best thing to do is to know your current environment and what is normal/abnormal. If CPU is not the issue, continue to continue the search to other parts of the system.
Back to top of page
Back to Performance Tuning Guide
