Linux Processing - Best Practices
Helpful configuration settings/information:
- Processing configuration:
- Giving a Linux guest more virtual CPUs than it can use doesn't necessarily provide more capacity - the scheduler
share options determine capacity. Provide just enough for peak capacity.
- The SHARE setting should be adjusted based on the number of vCPUs. If a guest has one vCPU and a SHARE setting of
relative 100 then is given a second vCPU but left at relative 100, the SHARE becomes 50 for each vCPU.
- Using Diagnose X'9C' instead of Diagnose X'44' provides 2-12% throughput improvement when there is processor
contention. In Diagnose X'9C', the virtual processor holding the required lock is specified so CP schedules only
that processor. This is more efficient management of spin lock situations.
However, too many 9C calls can show that a server has too many vCPUs. Use ESAUSRD to see what machines are
using which diagnose codes.
- Only configure the amount of vCPUs needed for a workload. Over allocating vCPUs can cause spin lock and or processor
cache issues.
- Linux SAR data - Velocity always keeps total CPU values. If the Linux machines have multiple CPUs the
values will be inflated compared to SAR. When the multiple CPUs are taken in to account, the values are much
closer.
- Velocity reports will show the relationship between parent and child processes. This is very important when diagnosing
performance issues!
- Note - Linux admins are concerned with "thread" time vs "core" time. On z/VM, the hardware is uses core time and with
SMT enabled, the software uses two threads per core or thread time. These are shown in the following reports:
- ESALNXS/ESALNXV - shows thread time
- ESALNXP/ESAUCD4 - shows core time
If Linux CPU utilization needs are an issue, consider using zVRM
Helpful ESAMON screens/ESAMAP reports:
Note: When looking at the different Linux zMON screens and zMAP reports, the data shown is dependent on the MIBs
(Management Information Base) files that are installed/enabled. The different sources of data for Linux below are
Velocity, Host and UCD (University of California Davis). There are screens/reports ESALNXx, ESAHSTx and
ESAUCDx respectively. For ESAHSTx screens/reports, deceased processes are not counted so the capture ratio may be low.
The Velocity MIB data screens/reports (ESALNXx) will provide the most detailed and accurate information with low overhead.
The Velocity MIB data screens/reports will also show parent/child process relationships.
Note: It is not a problem to
receive "deceased parent" console messages. This happens if the child process completes and the parent process is not
found - usually a timing issue. The CPU is minimal.
- ESALNXP - Linux Percent Usage by Process - Shows the statistical information about the Linux host and processes.
- ESALNXA - Linux Host Application Report - Shows information about the applications being monitored (groups of
processes).
- ESALNXS - Linux VSI System Statistics Report - Shows statistical information about the Linux systems being
monitored (system level information).
- ESALNXU - Linux Process Usage by User - Shows a breakdown by user of Linux process resource usage.
- ESALNXV - Linux Virtual Processor Analysis Report - Shows statistical information about the virtual processors.
- ESAHST1 - Linux Host Software Analysis - Shows information about the software programs running.
- ESAHSTA - Linux Application Host Statistics Report - Shows information about the host applications being monitored.
- ESAUCD4 - Linux UCD System Statistics Report - Shows statistical information about the Linux nodes being
monitored.
- ESAXACT - Transaction Delay Analysis - Shows an analysis of virtual machine states and wait states.
- ESAMFC - Processor Cache Analysis - Shows processor instruction information
Using zVPS to find information for solving issues with the Linux processing:
ESALNXP - Shows the statistical information about the Linux host and processes being monitored using the Velocity
MIB. This report can be used for chargeback or capacity planning.
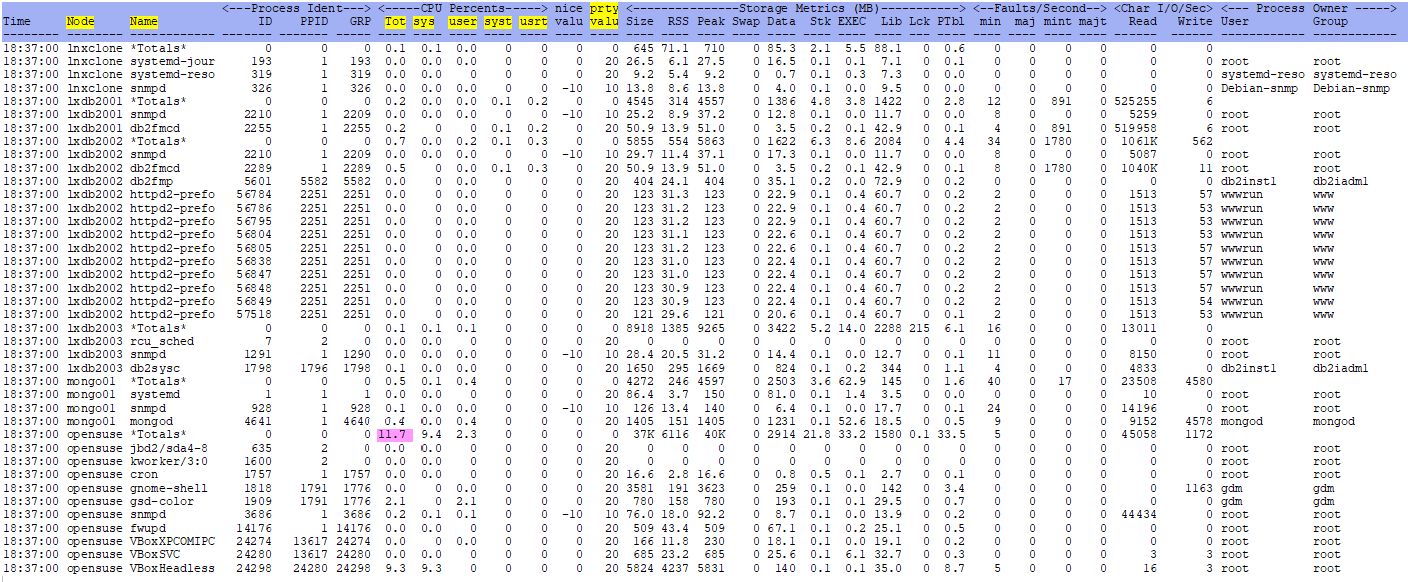
Node - This shows the zTCP node name where the process is running.
Name - This shows the name of the process. This name is truncated to 15 characters.
CPU Percents Tot/sys/user/syst/usrt - This shows the amount of CPU utilization. tot shows the total CPU;
sys shows the system CPU total; user is the amount the of CPU attributed
to the user; syst shows the system total CPU for the children; usrt shows
the user total CPU for the children. These are core times. When a child process completes, the resources return
to the parent. If a process is spawned by root, the resources return to root.
nice/prty valu - This shows these values set dispatch priority (how often a machine gets CPU time). Verify
these settings are correct for the processes running.
Note: Running a job/process across multiple servers can cause serious performance spikes. For example,
if a CRON job is run across 60 servers at the same time, there will be a large spike in utilization
that can cause other processes to have issues. Evaluate what may be running (if it is a performance process,
zVPS uses minimal resources and is highly accurate).
If the process needs to run, consider
staggering the start times across servers to lessen the impact.
ESALNXA - Shows information about the applications being monitored using the Velocity MIB. It adds up all the
processes.
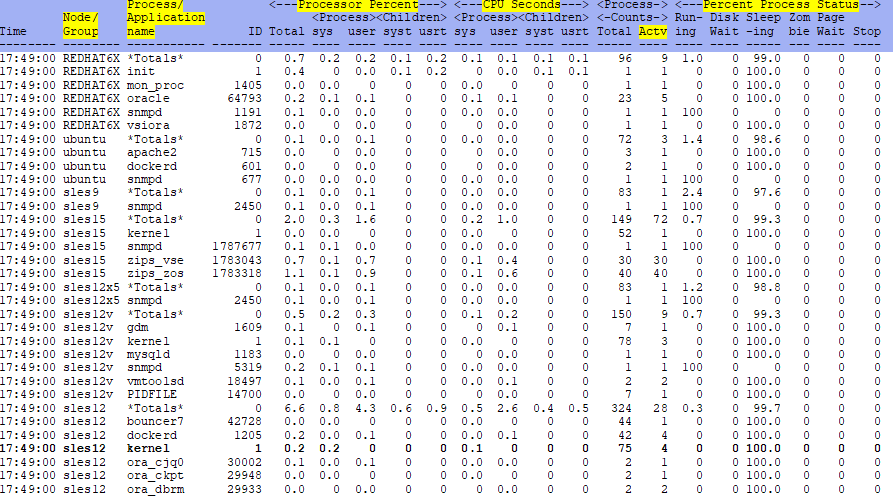
Node/Group - This shows the zTCP node name where the process is running.
Process/Application name - This shows the process or application name. Process names may be truncated to
15 characters.
Processor Percent - This shows the total system CPU plus the process CPU percent and then is broken down by
the parent system/user percentages and the children system/user percentages.
CPU Seconds - This shows the process system/user CPU intervals and the children system/user CPU intervals.
Process Counts Actv - This shows the active process count.
Percent Process Status - This shows the process status percentage for running processes, processes in disk wait,
sleeping processes, zombie processes, processes in page wait and stopped processes.
Check on any processes that are in any of these columns (except sleeping).
ESALNXS - Shows information about the Linux systems being monitored using the Velocity MIB. Can also look at
ESAUSCP for the same information from a z/VM perspective.
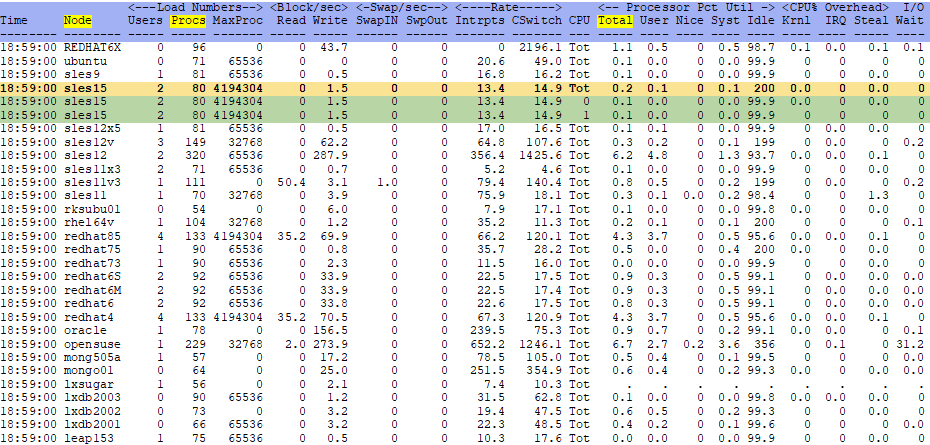
Node - This shows the zTCP node name where the process is running. Can click on a line (zVIEW) or
zoom (z/VM) to see the all the users in the group.
Load Numbers Procs - This shows the number of processes running.
Processor Pct Util Total - This shows the total CPU usage per processor. When running with multiple vCPUs,
linux will balance utilization across each -
a maximum of 40-50% on each vCPU is a good target.
ESALNXU - Shows a breakdown by user of Linux process resource usage using the Velocity MIB. This can also be used
for chargeback.
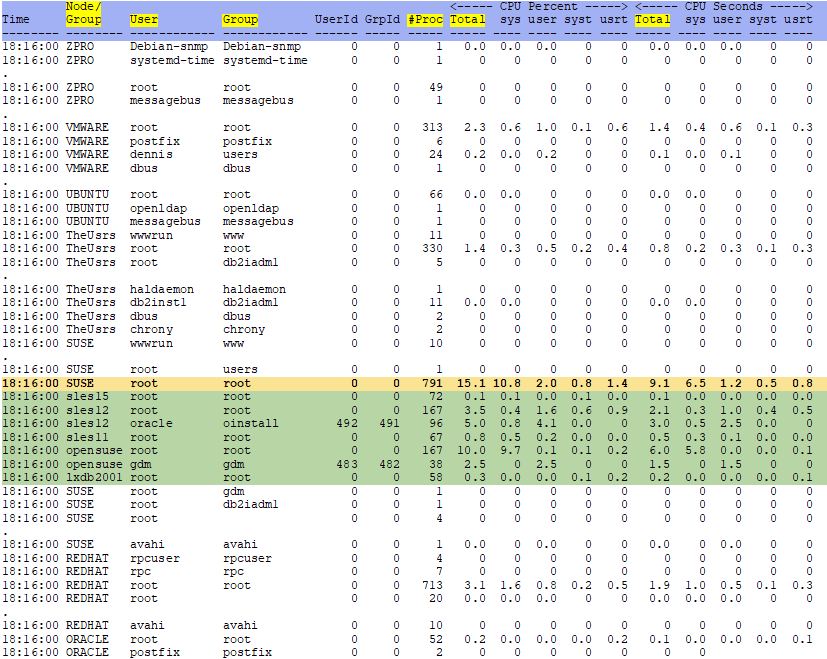
Node/Group - This shows the zTCP node name where the process is running. Can click on a line (zVIEW) or
zoom (z/VM) to see the all the users in the group.
User - This shows the user name of the process owner.
Group - This shows the group name of the process owner.
#Proc - This shows the number of processes summarized for this owner on this node.
CPU Percent Total - This shows the total percentage of processor utilization.
ESALNXV - Shows statistical information about the virtual processors using the Velocity MIB. This will add up the
entire process table.
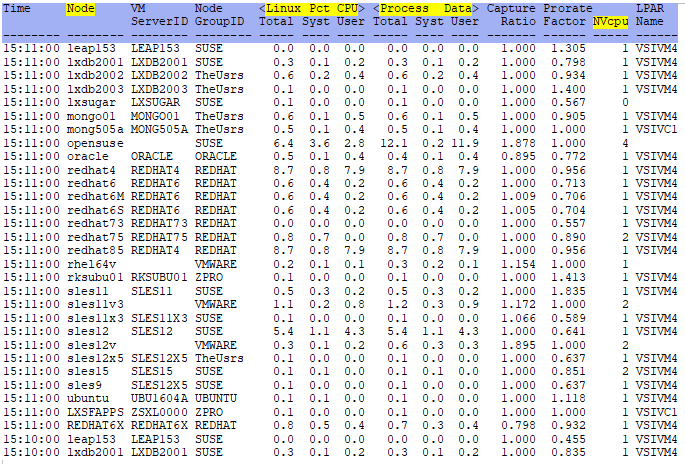
Node - This shows the zTCP node name.
Linux Pct CPU Total - This shows the total CPU percent processor utilization for this Linux.
Linux Pct CPU Syst - This shows the system CPU percent processor utilization for this Linux.
Linux Pct CPU User - This shows the user CPU percent processor utilization for this Linux.
Process Data Total - This shows the total CPU used by processes.
Process Data Syst - This shows the system CPU used by processes.
Process Data User - This shows the user CPU used by processes.
NVCPU - This shows the number of virtual CPUs as reported by the Linux system.
ESAHST1 - Shows information about the software programs running using the Host MIB.
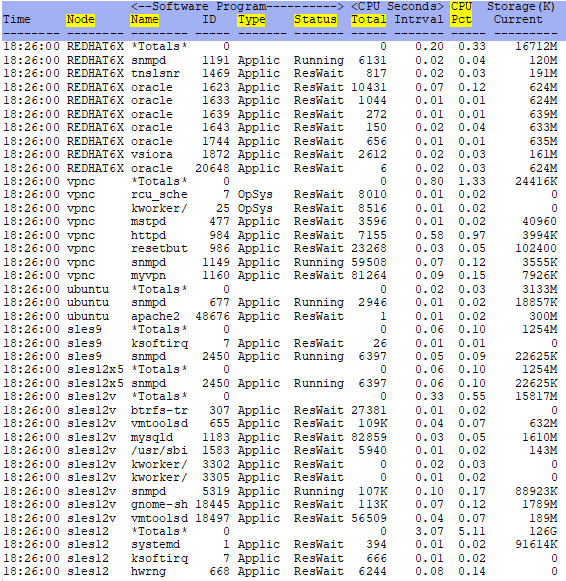
Node/Group - This shows the zTCP node name where the process is running.
Name - This shows the name of the software package.
Type - This shows the type of program - OpSYS (Operating System), DevDrv (Device Driver), Applic
(Application) or Unknown.
Status - This shows the status of the program - Running, ResWait (waiting on resources), Loaded
(waiting for Interrupt) or Invalid.
CPU Seconds Total - This shows the total CPU seconds consumed by this software from system initialization.
CPU Percent Total - This shows the total percentage of processor utilization during this interval.
On a multiple processor, this value could be over 100%
ESAHSTA - Shows information about the host applications being monitored using the Host MIB.
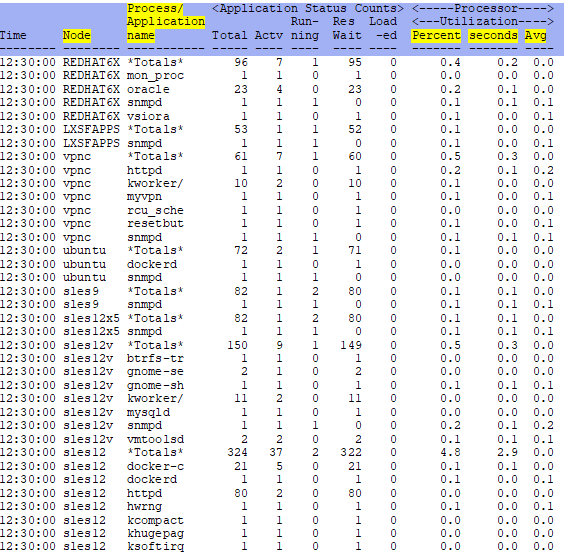
Node/Group - This shows the zTCP node name where the process is running.
Process/Application name - This shows the name of the processes running or *Totals* for the total for that
server.
Processor Utilization Percent - This shows CPU percent used by process. It is very similar to ESALNXA but uses
a different MIB.
Processor Utilization Seconds - This shows the CPU time in interval for a process (secs/100). It is very
similar to ESALNXA but uses a different MIB.
Processor Utilization Average - This shows the average CPU seconds per process. It is very similar to ESALNXA
but uses a different MIB.
ESAUCD4 - Shows statistical information about the Linux nodes being monitored using the UC Davis MIB.
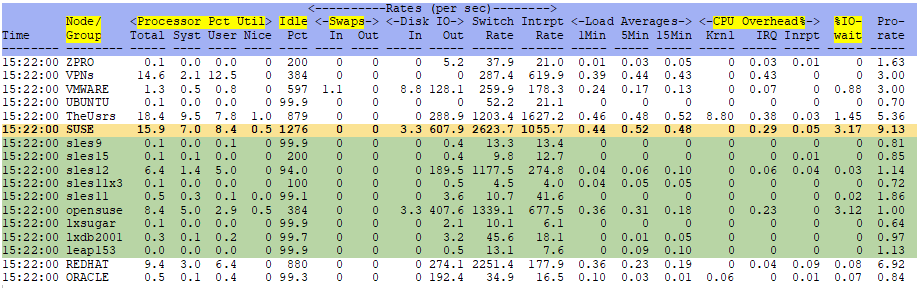
Node/Group - This shows the zTCP node name or node group. Can click on a line (zVIEW) or zoom (z/VM) to see
the all the users in the group.
Processor Pct Util Total - This shows the total processor usage.
Processor Pct Util Syst - This shows the system processor usage.
Processor Pct Util User - This shows the user processor usage.
Processor Pct Util Nice - This shows the amount of 'NICE' CPU time allocated.
Idle Pct - This shows the percent of processor idle time.
Swaps In/Out - This shows the swapping rate. This can show a potential issue if swapping is high.
CPU Overhead% Krnl - This shows the percent of processor identified as kernel time.
CPU Overhead% IRQ - This shows the percent of processor identified as IRQ (Interrupt ReQuest) time.
CPU Overhead% Inrpt - This shows the percent of processor identified as interrupt time.
I/O Wait - This shows percentage of time in I/O wait.
ESAXACT - Shows transaction delay analysis. IE, what resource is the Linux system waiting for?
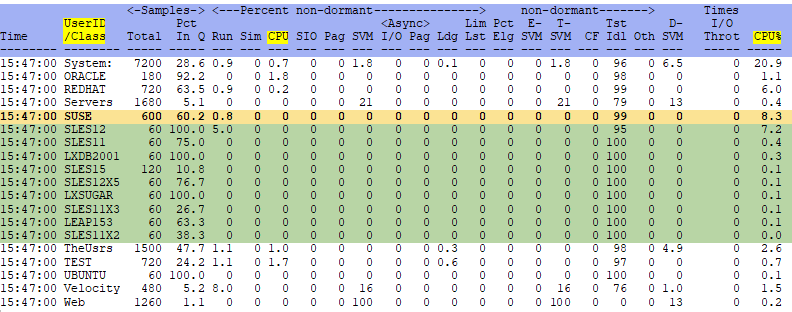
UserID/Class - This shows the machine user or user class. Can click on a line (zVIEW) or zoom (z/VM) to see
the all the users in the group.
Percent non-dormant CPU - This shows the percentage of time a user/server/class is waiting for CPU.
The virtual machine (virtual processor) is ready and waiting to be dispatched to run but there
is no physical processor currently available. A number over 20 is excessive.
If a machine has a high CPU wait, check the ESAUSR2 report to compare its CPU use to the total CPU use.
Check the CPU utilization for the system, the relative SHARE of the id and
also check LPAR weights/overhead.* See LPAR weights/overhead
CPU% - This is the CPU percentage used by the class or user.
ESAMFC - Shows processor instruction information. (must have Measurement Facility turned on in the LPAR to collect
the correct records for this screen/report - See
Enabling CPUMFC Records
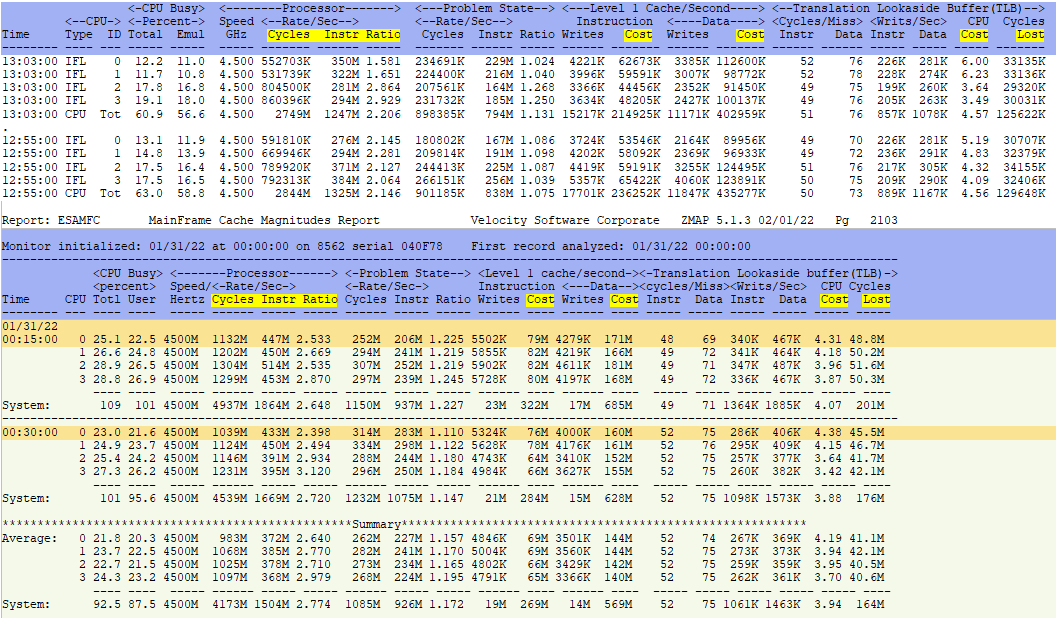
Processor Rate/Sec Cycles/Instr/Ratio - Shows processor cache effectiveness. The lower the ratio, the more
work is being accomplished.
Level 1 Cache/Second Instruction Cost/Data Cost - Shows the cost of cache misses.
TLB CPU Cost/Cycles Lost - Also shows the cost of cache misses - cycles being used for 'non-work' (such as
address translation) or 'idle' due to
time lost moving data from a higher level of cache/memory. Watch for changes
in each of these numbers - especially if changing parking settings and/or LPAR weighting.
Conclusions
There a many ways to look at the CPU usage for a Linux system and its processes. Many of these fields can be used to define
alerts based on CPU usage.
Back to top of page
Back to Performance Tuning Guide

