Linux I/O Analysis
Linux I/O - Best Practices
Linux has been instrumented to measure each I/O by device. ESANLXF has exposed this information as part of the Velocity
SNMP MIB. For each node that has the latest Velocity MIB, the filesystem information is captured. The information most
relevant to the performance analyst is the I/O response time measured in milliseconds.
When a Linux server is "acting up", it is good to be able to identify the process and application responsible. The
following reports can aid the identification of out-of-control processes. If there are I/O issues, they
might also be seen in z/VM in ESADSD2 which shows z/VM I/O statistics. See
DASD Utilization Analysis
Helpful ESAMON screens/ESAMAP reports:
- ESALNXI - Linux Process I/O - Shows I/O information for each process.
- ESALNXF - Disk File System Performance - Shows I/O information for the disk file system.
- ESALNXF2 - VSI Disk File System Configuration - Shows different I/O information for the disk file system.
Using zVPS to find information for solving issues with the Linux I/O:
ESALNXI - Shows the Linux Process I/O information.
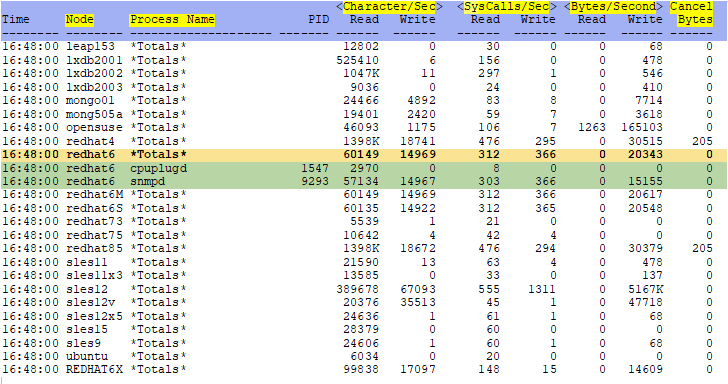
Node/Goup - This shows the zTCP node name. Can click on a line (zview) or zoom (z/VM) to see all of the
processes for the node.
Process Name - The name of the process or "Totals" to represent the sum of all the processes for that node. The
process name may be truncated to 15 characters.
Character/Sec Read - This is the number of bytes per second which this task read from storage. In other words,
the sum of bytes which this process passed to read() and pread().
It could be read from physical disk or from page cache.
Character/Sec Write - This is the number of bytes this task wrote to or shall be written to disk.
SysCalls/Sec Read/Write - This is the number of read/write I/O operations per second from syscalls such as
read(), pread(), write() or pwrite().
Bytes/Second Read - This is the number of bytes per second which this process caused a fetch from the storage
layer. Done at the submit_bio() level so it is accurate for block-backed filesystems.
Bytes/Second Write - This is the number of bytes per second which this process caused a send to the storage
layer. This is done at page-dirtying time.
Cancel Bytes - This is the number of bytes per second in which this processed caused not to happen by
truncating page cache. Such as if a process
writes 1MB to a file then deletes the file, it will not perform a write out. It will
show as 1MB of write and 1MB of Cancel Bytes.
ESALNXF - Shows the Linux disk file system performance. The ESALNXF report will show averages for the day which can
be used for trending purposes.
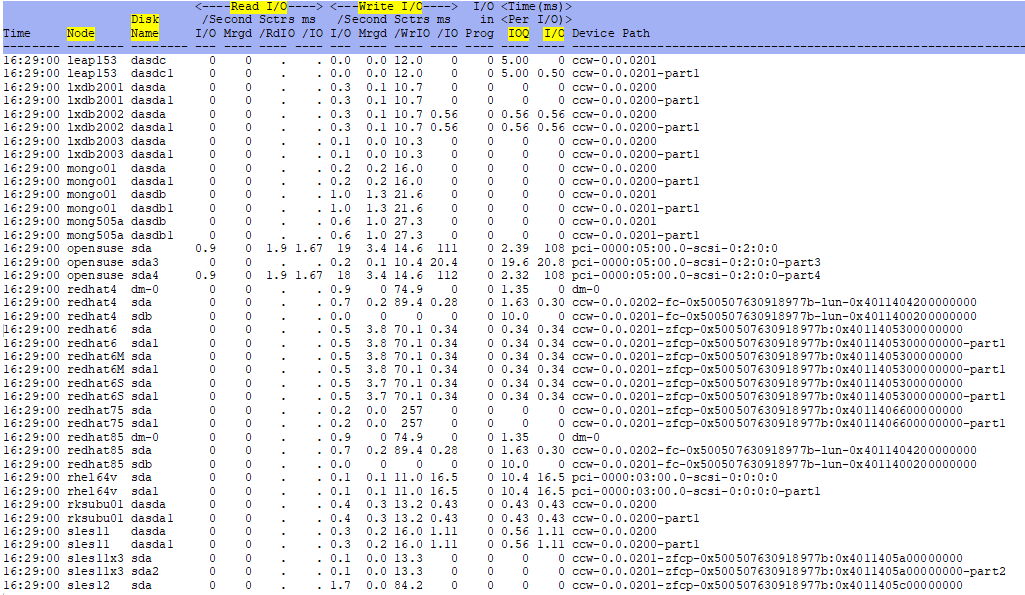
Node - This shows the zTCP node name.
Disk Name - This shows the name of the Linux disk device.
Read I/O - This shows information about disk reads.
Write I/O - This shows information about disk writes.
Time(ms) Per IOQ - This shows the average queue time per I/O. Use this to determine how well the
disks/partitions are performing.
Time(ms) Per I/O - This shows the average time per I/O.
Device Path - This shows the Linux by-path name for the device which includes the device number followed by
the partition identifier for CKD or the WWPN and LUN for SCSI. For Linux devices that have a z/VM virtual device, that
z/VM device number is the last number in the path. For example - dasdc above is on z/VM virtual disk 201.
ESALNXF2 - Shows Linux filesystem information. The ESALNXF2 report will show averages for the day which can be
used for trending purposes.
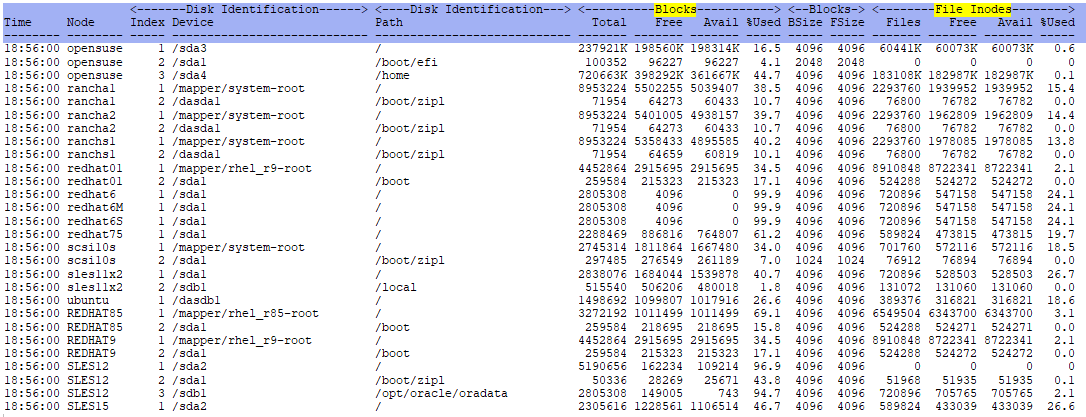
Node - This shows the zTCP node name.
Disk Identification Device - This shows the device name being reported.
Blocks Total/Free/Avail - This shows the total number of blocks, number of free blocks and number of available
blocks (for unprivileged users) in this filesystem.
Blocks %Used - This shows the percentage used. This number can be used at a glance to see percentages in use.
File Inodes/Files/Free/Avail - This shows the total number of inodes, number of free inodes and number of
available inodes (for unprivileged users) in this filesystem.
File Inodes %Used - This shows the percentage used. This number can be used at a glance to see percentages in
use.
Conclusions
If there are response time problems in the Linux system, it could be with I/O. These two screens/reports will show how
the file systems are performing. Alerts can be set up to warn of I/O spikes for investigation. The zMAP reports can be
used for trending.
Back to top of page
Back to Performance Tuning Guide

