
Understanding SMT
SMT - Simultaneous MultiThreading
The following information has come from z14-z15 machine data. More information to come for the z16-z17 machines!
- SMT Introduction
- SMT Performance vs Capacity
- SMT and Cache
- SMT and Chargeback
- Tips for running with SMT
- Conclusions
SMT Introduction:
- The objective of SMT is to better utilize the core processor.
- When workloads are waiting for L1 cache to be populated from other parts of cache/memory, processor cycles are 'wasted'. These cycles could be utilized by having a second thread to the core that could do work while the first thread is idle waiting for cache.
- With SMT and cache, it is critical that all engines in an LPAR are in the same book. If the LPAR has multiple engines across books, it will affect the efficiency of the cache and most likely negatively affect performance.
- The IBM Monitor provides metrics at the system level and the user level to assist in understanding how SMT impacts the system. There is also PRCMFC (mainframe cache statistics) data that shows the impact of two threads on the hardware cache, see Understanding MFC Data for more information. zVPS has been enhanced to utilize and expose these new metrics for every processor from z196 to current z16.
- Note:
- You must have Measurement Facility turned on in the LPAR to collect the correct records for PRCMFC data - See Enabling CPUMFC Records. Currently, the HMC data is more accurate than the CP monitor data.
- SMT must be enabled - add the statement MULTITHreading ENAble TYPE IFL 2 to the SYSTEM CONFIG (see the CP Planning and Administration Guide for more information)
- From a class A privilege machine - the command SET MULTITHREAD TYPE xxx nn can be used to adjust threads
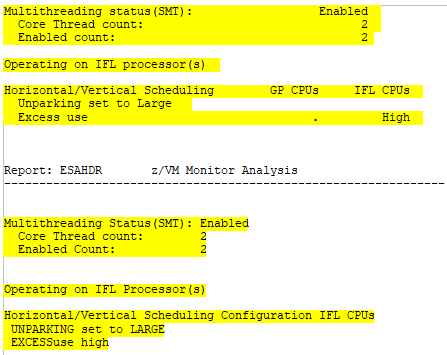
- Use the ESAHDR report (below) to verify that SMT is enabled and is using two threads.
- The default dispatch time slice (dspslice) time is 5. When SMT is set, it becomes 10. See CPU Analysis for more information about the this setting.
- With performance and SMT, there are two sets of counters. From the hardware perspective, there is one core with two threads. From the z/VM perspective, there are just threads (which it considers cores). This means on the screens/reports, it is important to know which perspective is being reflected or the numbers could be confusing. Core time comes from the HMC and thread time comes from VM. For example, ESALPAR shows the hardware perspective (cores) and ESACPUU shows the z/VM perspective (threads). Linux also only sees threads.
- When a core is assigned to an LPAR, both threads are part of that assignment. Even though they are both assigned, it does not mean they are both utilized. Thread idle time reflects this.
- There are three polarization designations for a core under SMT (determined by a system algorithm and LPAR weights):
- Vertical High (VHi) - These are completely entitled cores. They will use whatever they can get and PR/SM will strive to return to the same physical core for the most efficient use of cache.
- Vertical Medium (VMe) - These cores are entitled to a percent based on weights and a PR/SM calculation.
- Vertical Low (VLo) - These cores are entitled to very little. It is suggested to have no more than 1-2 VLo cores.
- There were many issues on a z13. If still on a z13 it is advisable not to turn on SMT due to address translation bottlenecks.
Understanding how to view CPU utilization with SMT
Helpful Screens/Reports:
ESAHDR - Shows SMT configuration information.
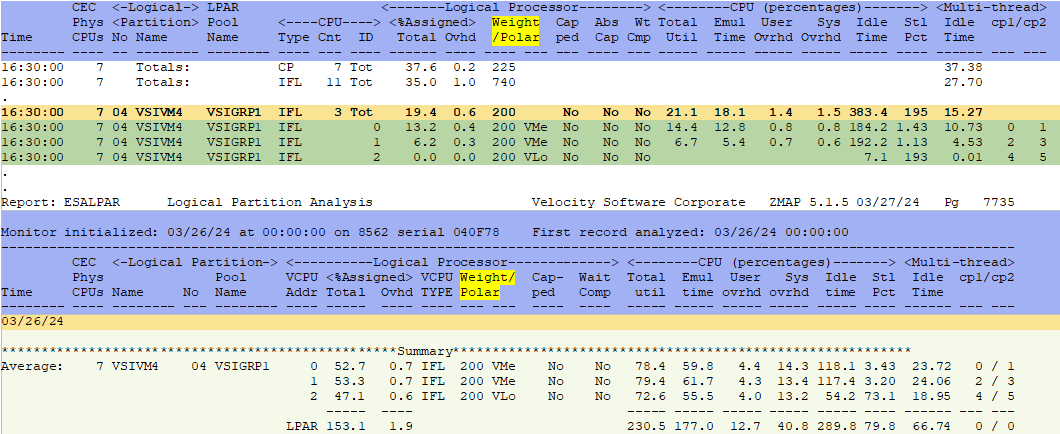
ESALPAR - Shows the LPAR weight/polarization (and other information that will be discussed later).
Back to top of page
SMT Performance vs Capacity:
Presentation - SMT for z/VM Understanding and Using Planning and Chargeback- What is more important - performance or capacity? Of course the answer is both!
- IBM has stated in many places that when running in SMT mode, workloads will run slower. There are now two workloads sharing the same processor core, so at some times there will be cycles where both workloads are ready to run but one has to wait. However, capacity will increase - on a newer box, by up to 80%.
- Doing capacity planning becomes more difficult with SMT. There are two measures for increased capacity with SMT:
- Instructions executed per second. If instructions executed per second increases per core, capacity has increased.
- Cycles per instruction. This is how many CPU cycles it took to execute an instruction. If this number drops, the more work is being done with less CPU. If it goes up significantly, it is possible that work is being executed taking much more time and cycles. Then the available system capacity is much less than it appears.
- The number of instructions being executed is the best way to determine the efficiency of the system. The more instructions executed, the more work. The less cycles per instruction shows better efficiency.
- Processor utilization is actually not as important as how many instructions are being executed.
- The engine speed, the number of cycles being consumed and how many instructions are being executed are all known metrics that can be used to compute the cycles per instruction and thus the configuration efficiency.
- There is a cost for both Transaction Lookaside Buffer (TLB) work and gathering data from other levels beyond Level 1 cache (Level 2/3/4L(ocal)/4R(emote)/Memory). These costs must be weighed against the possible capacity gain.
- Spreading work across less engines will be helpful as the competition for cache goes down, if there is sufficient capacity.
- Thread idle is the time where one core/two threads are assigned to an LPAR but only one of them is actually doing work. During thread idle, one thread was being utilized and one thread was idle, but the core was assigned. If thread idle time is half the total, a core was assigned but only one thread was being used. High thread idle time indicates unused capacity.
- When turning on SMT, if the utilization goes up but the instruction count goes down, it was not helpful.
- The IBM monitor records (and the HMC) provide metrics for both the system and user levels. There are mainframe cache statistics that will show the impacts on cache when running two threads.
- Capacity planning has to be done on cores, not on threads.
- The zVPS screens reports can be used to investigate the efficiency of a system configuration.
Helpful Screens/Reports:
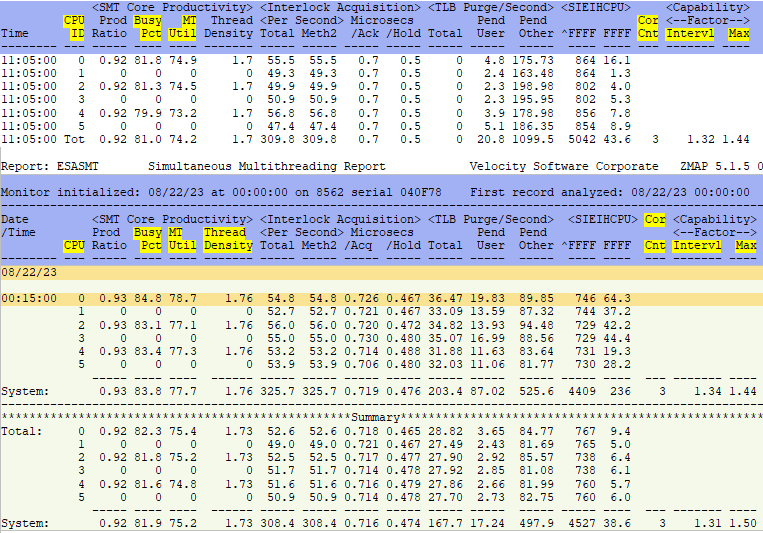
ESASMT - Shows the Simultaneous Multi-Threading report.
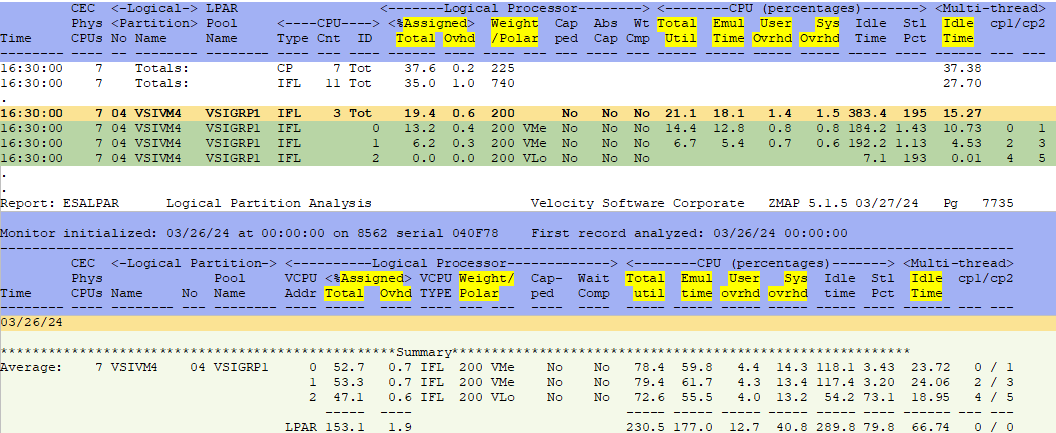
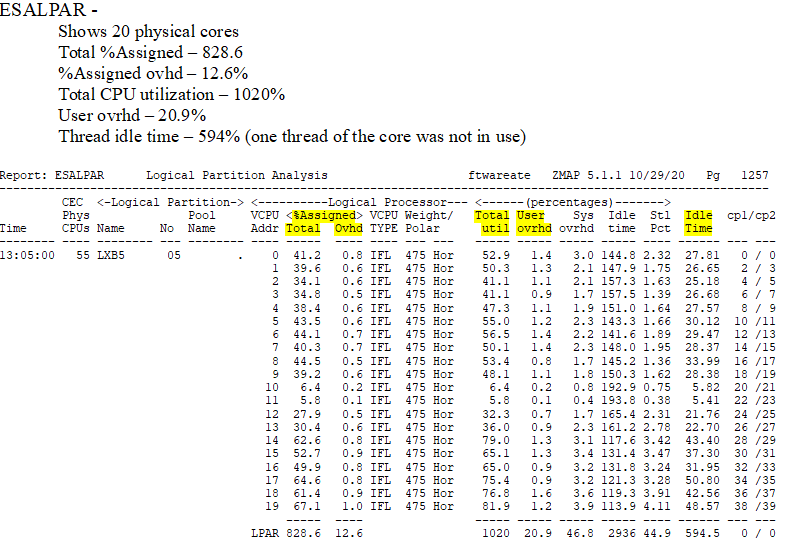
ESALPAR - Shows logical partition characteristics and processor utilization for each and the system as a whole.
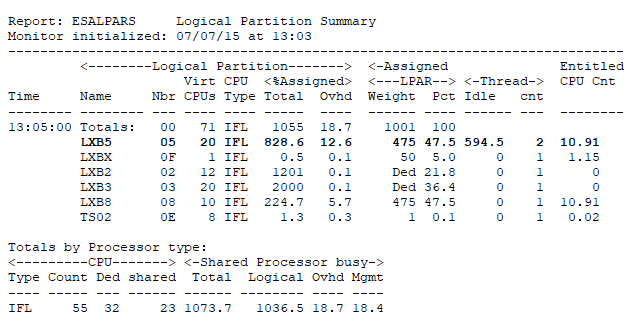
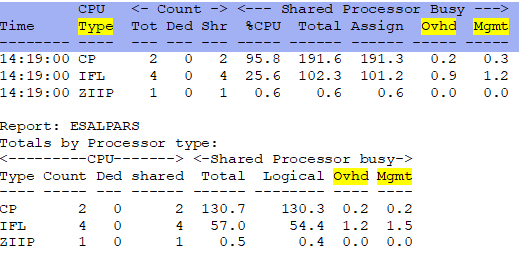
ESALPARS - Shows a summary of the logical partition configuration and utilization for each partition.
- It is entitled to 10.9 cores - guaranteed based on weight, etc (for more information about entitlement see LPAR weights/overhead analysis)
- It was assigned 828% or 8.2 cores for this minute interval (both threads are always assigned)
- Subtract the assigned overhead of 12.6% (very high overhead numbers could show issues)
- Real work then happened on 816% of cores or 1632% of threads (cores * 2)
- Thread idle time was 594% - when one thread was in use and the other was idle
ESALPMGS - Shows how the hardware/processing resources are distributed in the box.
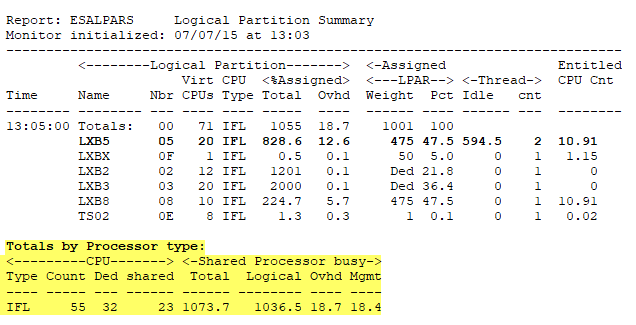
- The total busy is 1073%
- Of which 18.7% was used for (logical) Overhead
- And 18.4% was used for (physical) Management Overhead
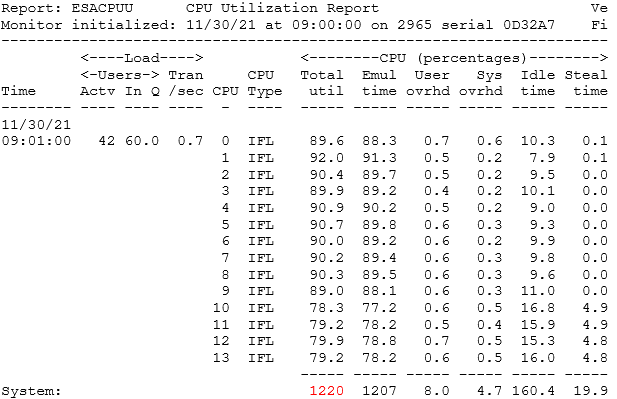
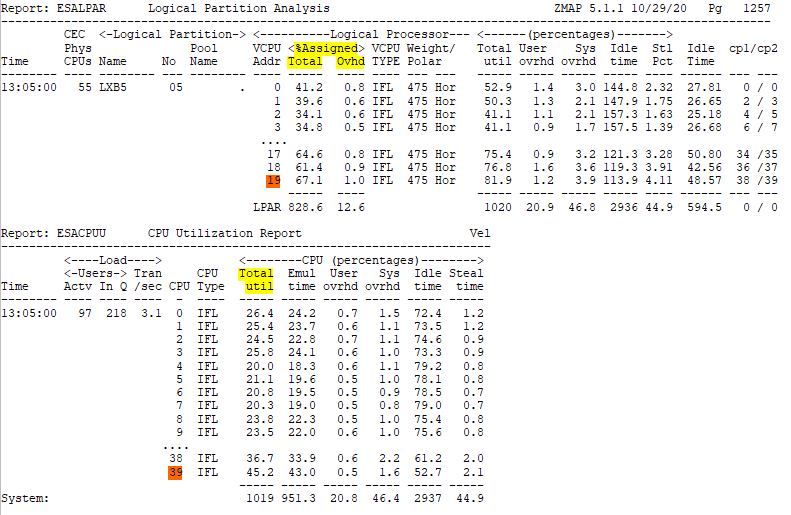
ESALPARS/ESACPUU (screen) - Shows processor count from a hardware perspective (ESALPARS) vs from a z/VM perspective (ESACPUU).
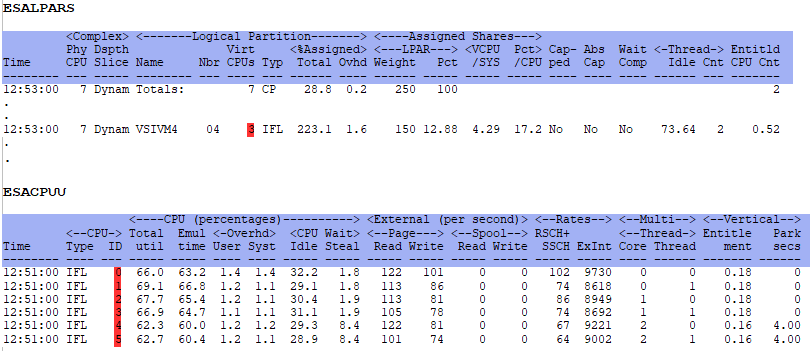
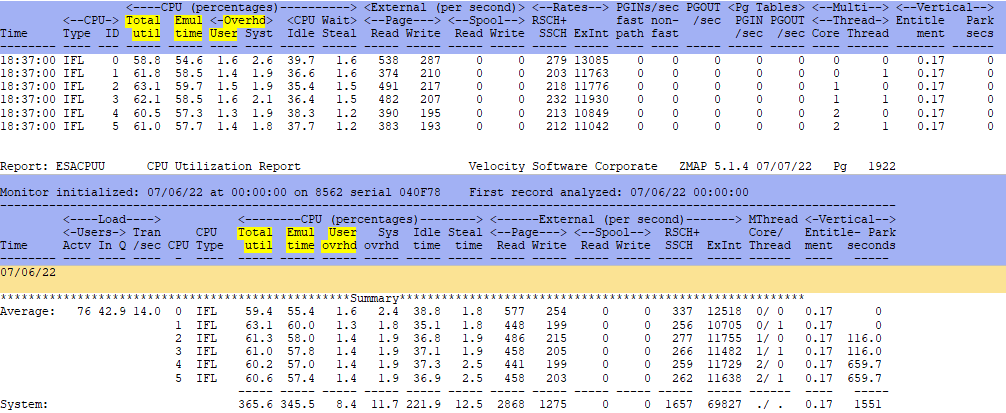
ESALPAR/ESACPUU (report) - Shows processor utilization from hardware perspective (ESALPAR) vs from a z/VM perspective (ESACPUU).
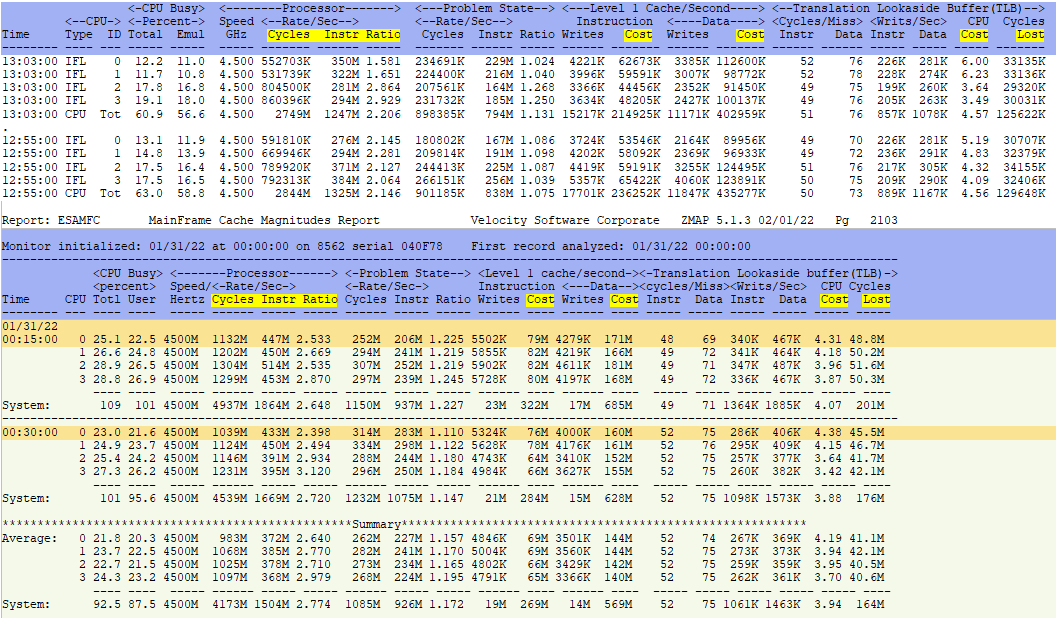
ESAMFC - Shows processor cache use and instruction information.
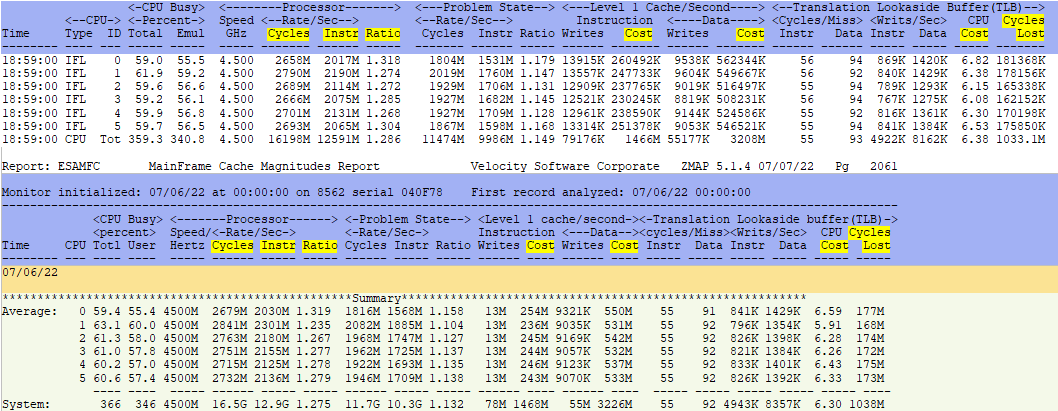
- This report shows 6 threads for 3 vCPUs.
- There were 16.5G cycles consumed for the day.
- Of that 1468M were used for Instruction cache load and
- Another 3226M were used for data cache load
- So of the 16.5G cycles consumed,
- 11.8G were used for executing instructions,
- But there is also the TLB Cycles Lost that must also be added
Back to top of page
SMT and Cache:
- Affinity processing says a vCPU will be be dispatched on the same thread/CPU so everything will stay in the L1 cache. However, due to the high rates of polling in most servers, this doesn't tend to work.
- Systems like Linux, TPF and DB2 do a lot of dispatches doing small pieces of work. z/OS has processes that do fewer large pieces of work, which has better use of cache. So this concept works well for z/OS but not necessarily for z/VM.
- The new z processors are making cache processing more and more sophisticated which increases the amount of time a core can actually execute instructions.
- For any instruction to execute, everything needs to be in the L1 cache.
- Any time there is a cache miss, the core sits idle while the data comes from level 2, level 3, level 4, level 4 on a remote book, or from memory. Each of these sources requires an increasing number of cycles to load the data into the level 1 cache.
- If the processor cache is overloaded, then cycles are wasted loading data into the level 1 cache. As contention for the level 1 cache drops, so do the cycles used per instruction. As a result, more instructions are executed using much less CPU.
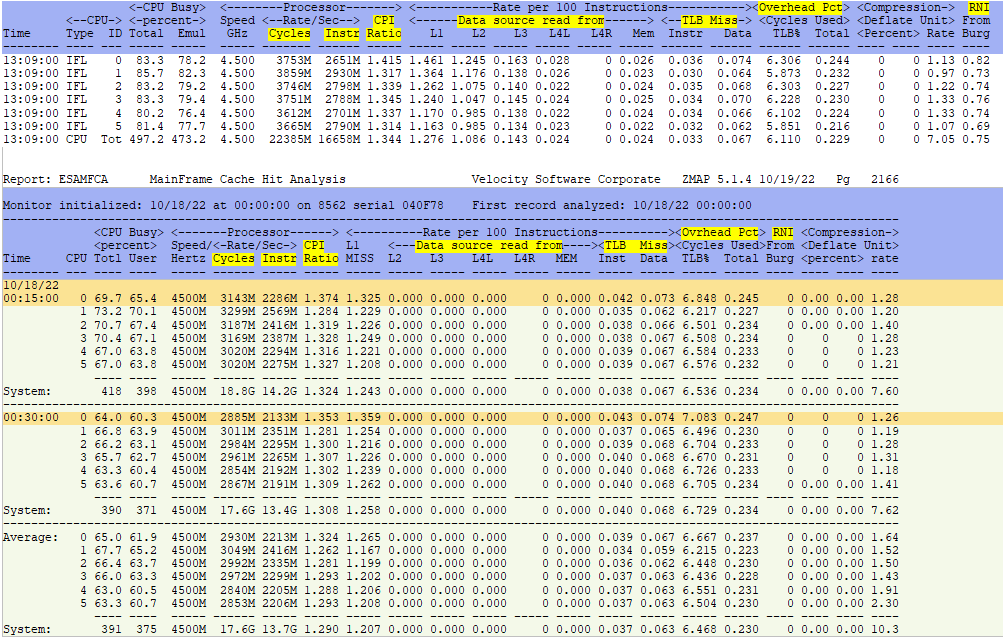
- John Burg has a calculation for the cost of each of the different layers of memory called Relative Nesting Intensity or RNI. If the RNI numbers get larger, less work is being done. RNI is definitely affected by turning on SMT as it affects cache. Also, this number does not include the cost of DAT translation (TLB). For a z15 the number of cycles it takes based on RNI calculations of where the cache is located to move to L1:
- From L3 - 1.3 cycles
- From L4L - 4.3 cycles
- From L4R - 9 cycles
- From Memory - 19 cycles
- The levels of cache are:
- L1 cache - This area is on the core (private) and is the fastest and most efficiently used. All instruction and data information for a transaction must be in L1 cache before it can be run.
- L2 cache - This area is also on the core (private), is usually larger than L1 but is also slightly slower.
- L3 cache - This area is shared by all of the cores on the same chip.
- L4L cache - This area is shared by all of the cores on the same local book.
- L4R cache - This area is shared by all of the cores on the same different/remote book.
- Memory - This area is actual memory.
- If competing for cache, it may be better to spread your workload across less engines. This also helps with the cost of address translation.
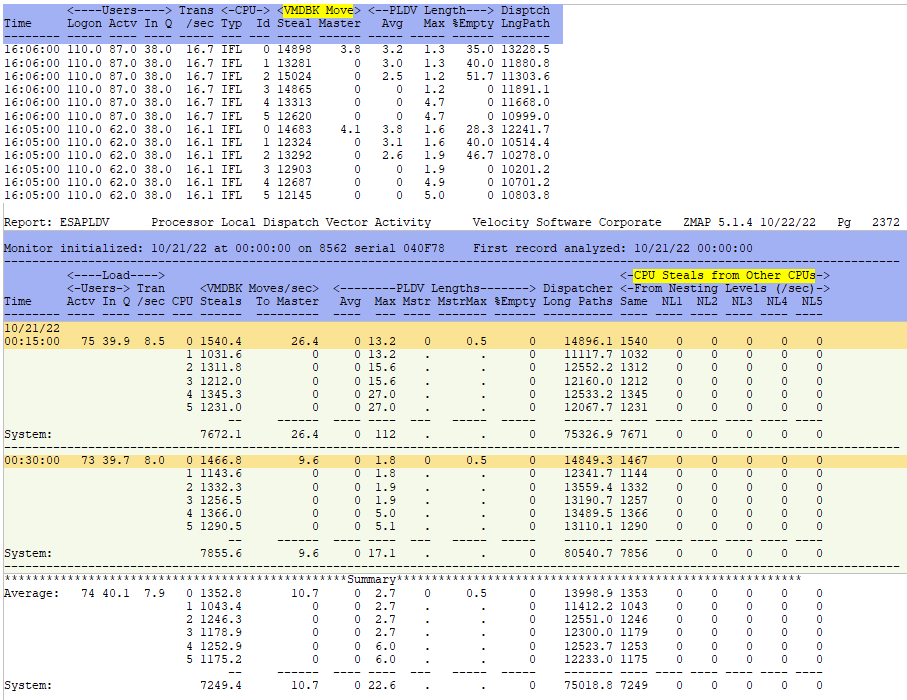
- Another way to determine if your workload is benefiting from enabling SMT, look at the dispatch rate (ESAPLDV). If it is climbing towards 5-10k/sec SMT may not help. If it is closer to 500-100/sec, SMT may be more helpful. The higher the dispatch rate, the L1 cache becomes less and less effective, creating a higher RNI number.
- The TLB or Transaction Lookaside Buffer holds the addresses where data exists. Every time data is moved from anywhere to the level 1 cache, the addresses have to be translated in the TLB - which causes more overhead. However, with each new IBM machine the DAT translation is improving. A z13 only had one TLB, as of the z14 there was a 'quad' TLB. The z16+ have had even more improvements.
- Applications with smaller transaction size/duration don't do as well with SMT as the cache is constantly changing which causes high overhead.
- Polling applications such as Linux are continuously putting large/unique pieces of work into cache. This causes high cache turnover and a lot of overhead.
ESAMFCA - Shows processor cache hit information.
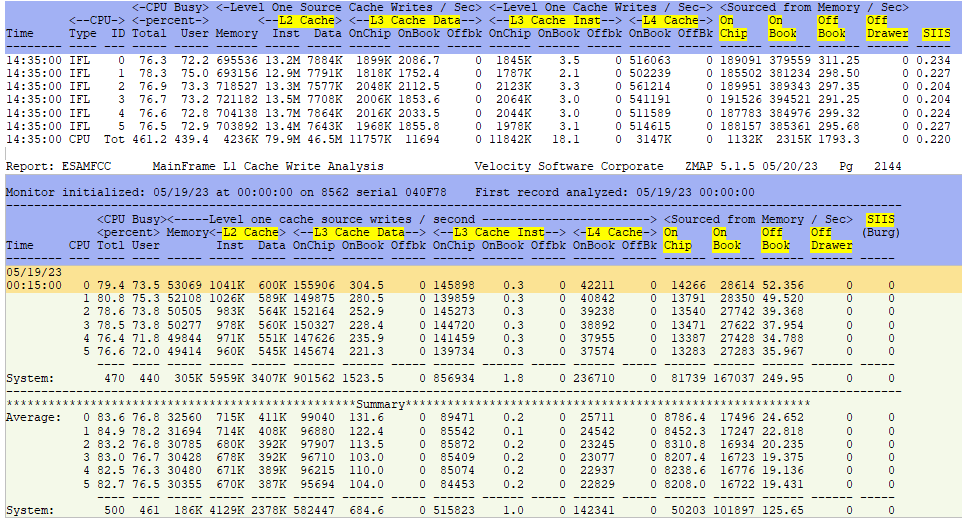
ESAMFCC - Shows processor L1 cache write analysis.
ESAPLDV - Shows processor local dispatch vector activity
Back to top of page
Chargeback with SMT:
Presentation - SMT for z/VM Understanding and Using Planning and Chargeback- Chargeback with SMT enabled is challenging.
- Chargeback can't necessarily be based on a CPU second anymore as there are cycles being used for 'non user' work like cycles used to get data back into L1 cache, DAT translation, etc.
- Chargeback needs to be based on cores, not threads.
- Emulation time shown on many reports is more fitting of what the users are using, plus user overhead. This is can be a decent chargeback metric.
- With SMT enabled, there are two threads (one core) assigned that can do work (but don't necessarily do work). This is seen with thread idle.
- z/VM numbers/capture ratios for CPU consumed by a user are very accurate with SMT not enabled. With SMT enabled, there is the possibility of using more than a CPU second as there are now two threads per core so twice as much potential capacity, but with additional overhead.
- Charging becomes dependent on which metrics are being utilized. With SMT, the CPU consumed number fails to be repeatable and changes with workloads. Double the potential (two threads per core), plus additional cache/TLB work and thread idle numbers all combine to make chargeback very interesting!
- Data may require a 'fudge factor' to create a chargeback model.
- PRSM overhead - 1%
- LPAR overhead - 3%
- LPAR capture ratio - 1%
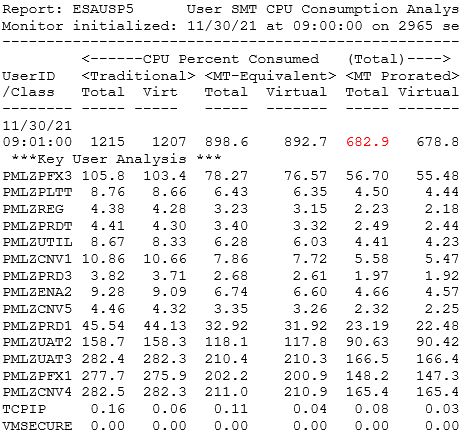
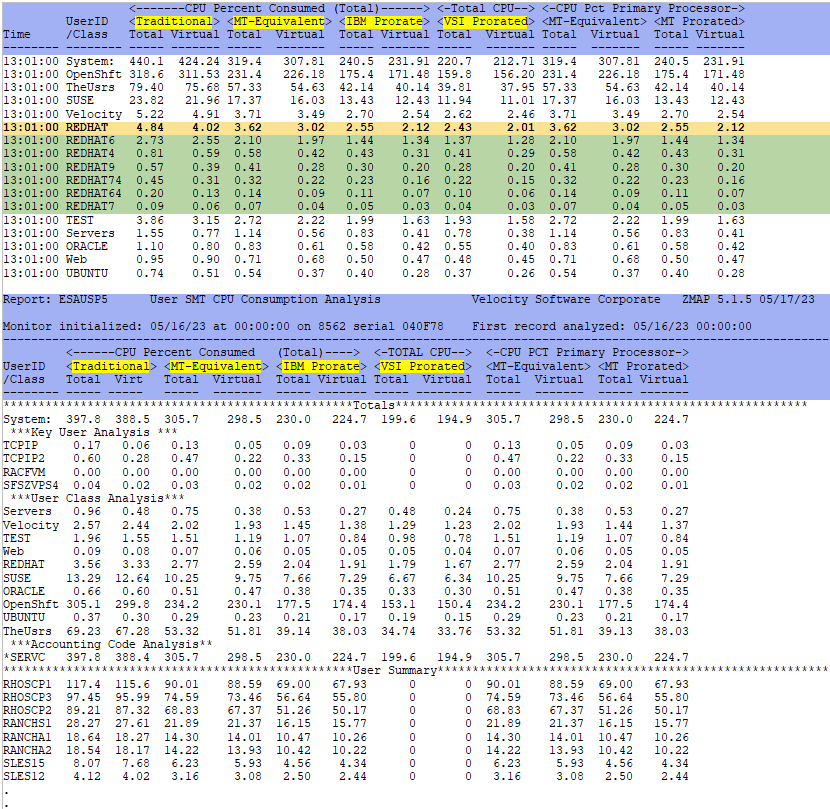
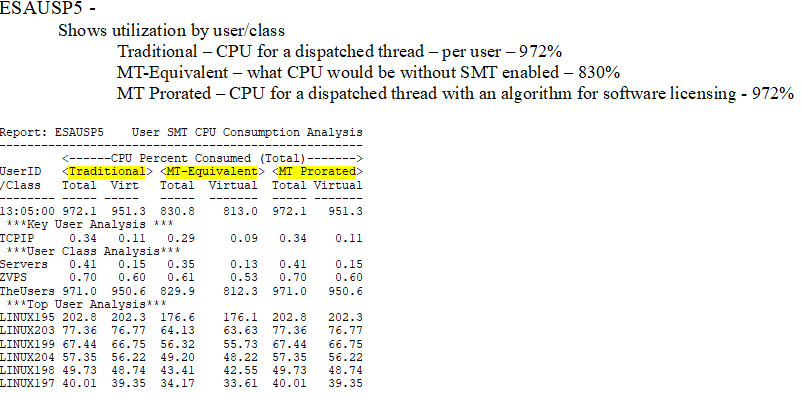
- There were new metrics created for SMT - "MT-Equivalent" and "IBM Prorated" - shown on ESAUSP5. Velocity now has a different number in VSI Prorated (also on ESAUSP5) which more closely matches the HMC metrics.
- MT-Equivalent is meant to show the CPU time that would be used if this were a non-SMT environment. This can be used for performance.
- IBM Prorated is meant to show the CPU cycles that were really used - approximately/prorated. This number is determined from an IBM internal calculation.
- For both MT-Equivalent and IBM Prorated - the Total Percent Consumed numbers match the Primary Processor numbers.
- VSI Prorated is a calculated number that more closely matches the HMC metrics and is the best number to use for chargeback.
- The following reports are helpful in showing the available metrics, then a decision can be made as to which ones make sense in your environment: (See examples below)
- ESAMAIN - Shows the SMT prorate ratio.
- ESALPAR - Shows the virtual cpus by LPAR with their Total %Assigned, Overhead and Thread Idle numbers.
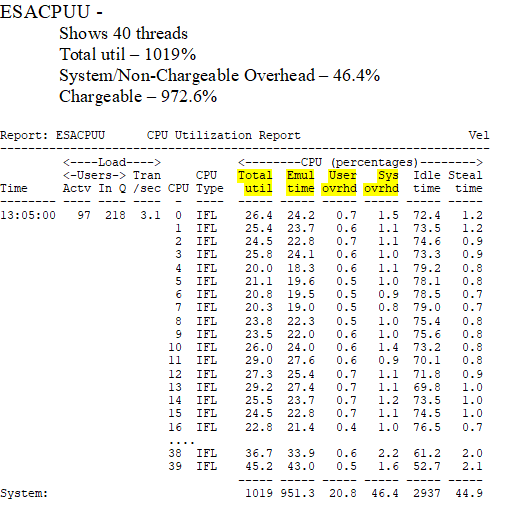
- ESACPUU - Shows the Total Emulation time and User/System Overhead times.
- ESAUSP5 - Shows the different SMT metrics by user - Traditional, MT-Equivalent, IBM Prorated and VSI Prorated.
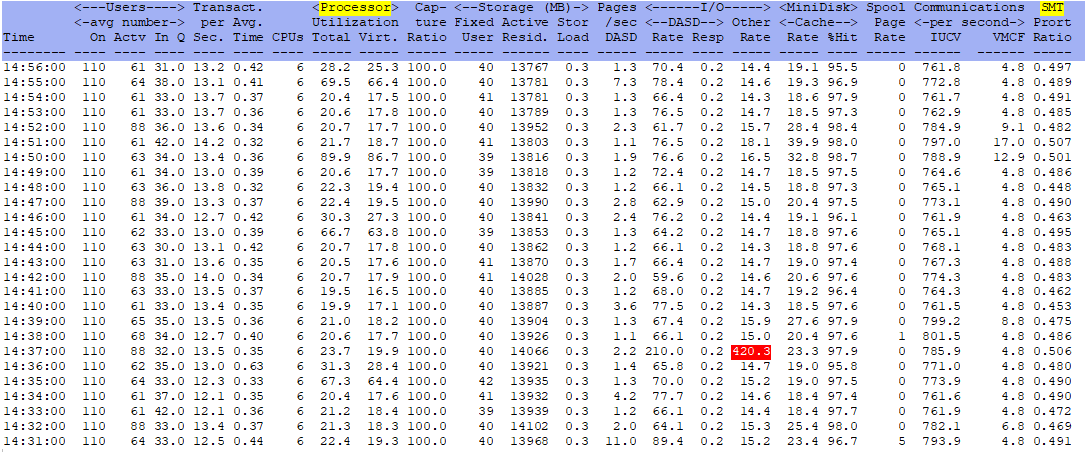
ESACPUU - Shows CPU utilization. These are z/VM times and are accurate.
ESAUSP5 - Shows user SMT CPU percent utilization by user.
Example of a chargeback scenario:
Back to top of page
Tips when running with SMT:
The following are suggestions or things to remember when using SMT:
- SRM Settings for SMT:
- SET SRM POLARization VERTical - Set polarization to vertical - this is mandatory for SMT.
- SET SRM UNPARKing Large - Set parking to Large to leave all the high/medium and most of the low cores unparked.
- SET SRM EXCESSuse TYPE IFL High - Set excessuse to high to specify an aggressive attempt to use low cores for unentitled CPU capacity.
- On ESALPAR - SMT will show even for CP engines (even though it only applies to IFL engines) - One core with two threads, one idle.
- ESALPAR shows the High, Medium and Low core designations.
- ESALPAR shows the number of cores (LPAR/hardware perspective). ESACPUU shows the number of threads (z/VM perspective).
- There are two different utilization numbers:
- Core busy (LPAR/hardware perspective)
- Thread utilization (z/VM perspective)
- In general - the fewer engines defined to a server:
- The more share they get
- The better entitlement they get
- The better utilization of cache
- And therefore the better throughput they get
- L1/L2 cache:
- When an engine is parked, the L1/L2 cache becomes useless and must be replaced.
- In Linux, large/fast/different work is being dispatched quickly so L1/L2 cache is constantly being replaced.
- SMT provides two 3/4 speed engines - which adds capacity. The work may go 1-2% slower, but waits 50% less. Performance impacts are no longer seen with SMT (after the z13).
- A key to system performance is the most efficient use of cache.
- The potential gain from SMT is the percent of cycles that are 'unused' being put to use.
- "T-Shirt style charging issues:
- A "small T-shirt" system can actually use more than people are paying for.
- A "large T-shirt" system may not be using all their capacity (and can possibly cause cache/overhead issues).
- It is best to attempt to charge by consumption, not by blanket Linux x86 definitions.
- SMT Capacity planning:
- Capacity planning is done with cores, not threads.
- Capacity improvements are "dependent". Use the information above to do before/after benchmarks!
- Enhancements to capacity are measurable. Use the information above to do before/after benchmarks!
- HISTORY KEYWORD USEACT.VSITTIME can be used to extract the VSI-prorated numbers for benchmarking. This can be done even before SMT is enabled.
- Evaluate each LPAR for the value derived from enabling SMT which would be a CPI (Cycles Per Instruction).
Back to top of page
Conclusions:
There are a lot of measurements that are not in agreement with SMT. In general, follow the advise below to determine for your system if SMT is beneficial. If you have interesting data or need further assistance, contact Velocity Software.
- Systems with low utilization - SMT is not useful.
- When capacity is not really an issue.
- Response time not be affected when left in horizontal polarization.
- Systems with high utilization and intense workloads (SAP, Oracle, etc).
- Capacity should see improvements - up to 80% has been seen.
- Cache is utilized better (dedicate engines when possible) so response time shouldn't suffer much.
- Systems with high utilization and polling workloads (like Java, WAS, etc).
- Cache competition is very very high - capacity may drop - validate with ESAMFC.
- Response times will get worse.
Back to top of page
