
System Utilization
The first step in determining the system utilization is by reviewing ESAMAIN (screen) and ESASSUM (report). The
screen shows the current utilization and the report shows for a full day so that multiple days can be reviewed to
track trends. Also, the ESAOPER screen can show interesting events and obvious errors that can affect performance.
Helpful ESAMON screens/ESAMAP reports:
- ESAMAIN - System overview - shows current total CPU processor utilization
- ESASSUM (zmap report) - Subsystem activity - shows the main system overview for the day
- ESAOPER - Operator/System Log - shows the log of system events
ESAMAIN - This shows the main system overview.
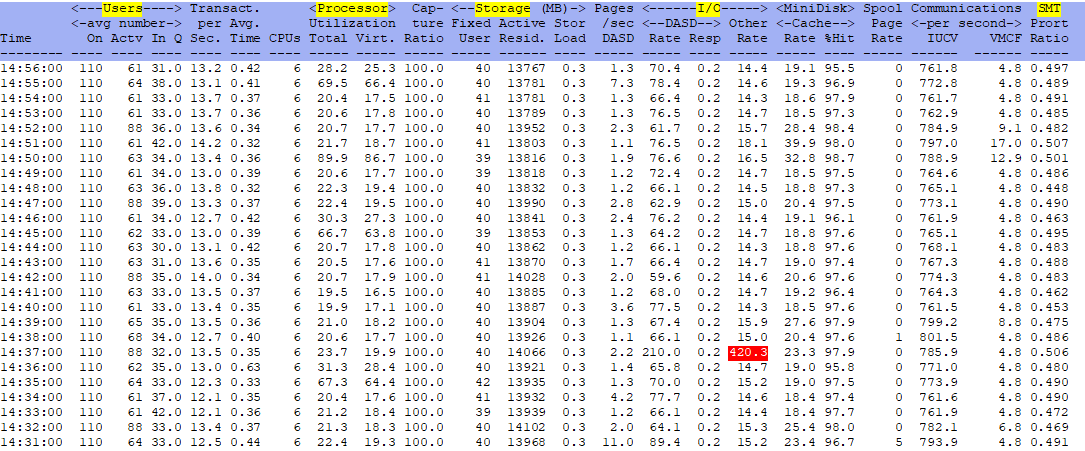
NOTE: Setting up the parameters in zMON to properly highlight when utilization has crossed a particular threshold makes it very easy to see at a glance if the sytem load is higher than normal. In the example above, it was easy to see a big spike in Other Rate I/O. Further investigation from ESADEV2 in Input/Output Subsystem showed more information about the hardware having the spike (the non-DASD screen). ESAUSR3 showed the group/servers that caused the spike (an additional user screen). Legitimate testing was being done at the time, but it was very easy to see the issue and chase it down.
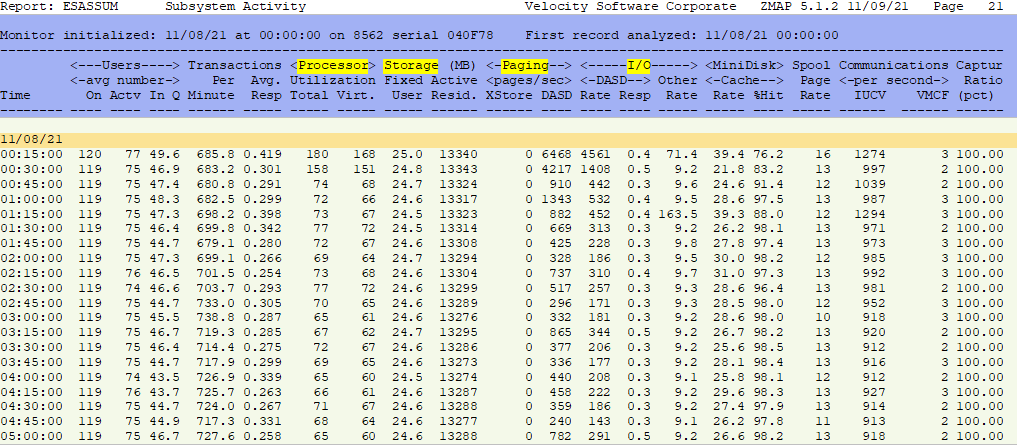
ESASSUM - This shows the main system overview for the day.
ESAOPER - shows the log of system events:
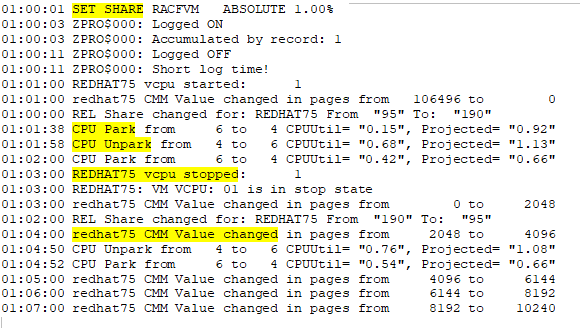
Many important things can be seen in the Operator log:
- Obvious errors - such as a DASD going offline, etc
- SHARE settings changing
- CPU Parking/Unparking
- CMM values changing
Conclusions:
If the processor utilization numbers have jumped dramatically, there is a reason. The above screen/report will show at any given moment or over the course of time if the system utilization has been higher than normal. If there is an actual problem, follow the System Problem flow to see what else could be the cause. If this is a trend, it may be that more hardware is needed or there is something else to be found.
Back to top of page
Back to Flow Chart main page
