
Flow Chart Analysis
z/VM Problem Determination Flow Chart Analysis
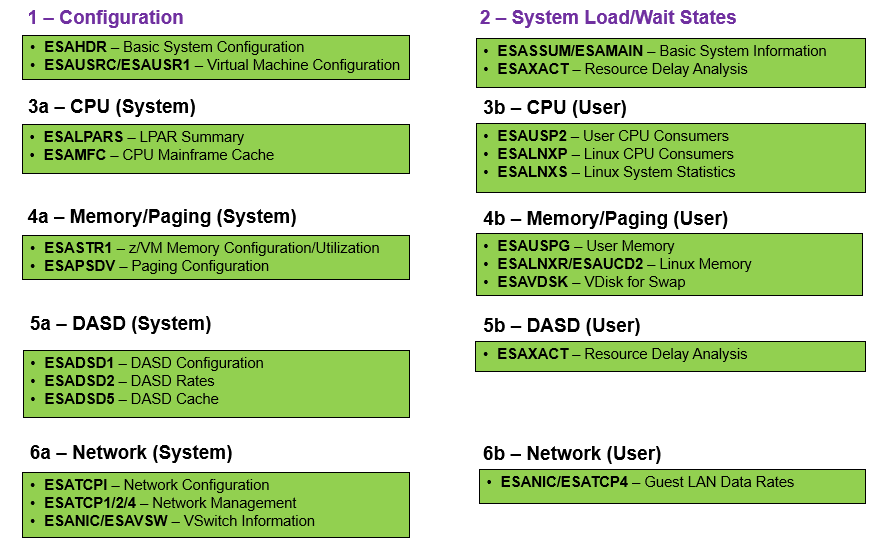
The chart below shows pictorally how to go through the main reports in a top-down manner. As a general rule, start with configuration (1), then check the system load (2). Determine if it is a probable system or user problem by investigating the information in configuration/system load. If it is still not apparent, follow the system column on the left side of the chart. If one user seems to be the culprit, follow the subsystems on the right side of the chart. In sections below the picture, there will be details, tips and additional reports to help solve the problem.
(0) Read this first for pertinent information about Velocity's performance methodology and guidelines:
(1) What is the system configuration - Is the system configured properly and as expected?
(2) What is the current view of the system?
- System Load Analysis - General system performance information
- Wait State Constraint Analysis - What resources are unavailable to the users/servers
- Be sure to check ESAOPER for errors or other pertinent information around the time of an issue
- If using the zTUNE product, there are many helpful performance suggestions in the ESATUNE report that may be all that is needed to solve a problem quickly!
(3) What are the system and subsystems showing? (Is it a system problem?)
- CPU - General Information
- LPAR - General Information
- LPAR Weights/Overhead Analysis - Is the LPAR performing as expected
- LPAR Pool Analysis - If in use, how are the LPAR pools doing
- Memory - General Information
- DASD - General Information
- DASD Configuration Analysis - Is the DASD subsystem configured correctly
- DASD Utilization Analysis - How is the DASD performing
- DASD Cache Analysis - How is the DASD cache performing
- Network - General Information
- Network Configuration Analysis - Is the Network subsystem configured correctly
- Network Data Rate Analysis - How is the Network performing
- QDIO Utilization Analysis - If in use, how is it performing
- OSA Utilization Analysis - If in use, how is it performing
- Channel Analysis - How are the channels performing
(4) What are the users showing? (Is it a user problem?)
- User - General Information
- Wait State Constraint Analysis - What resources are unavailable to the users/servers
- CPU - General Information
- User Resource Utilization Analysis - Find problem users/servers
- Linux Configuration Analysis - How are the Linux servers configured
- Linux Process Utilization Analysis - How are the Linux processes performing
- Validate Virtual CPUs - Does a Linux server have too many vCPUs
- Memory - General Information
- DASD - General Information
- Network - General Information
