
Specifics - System page analysis:
Paging happens when the storage subsystem does not have enough memory to complete its work. Paging involves writing data out to disk which causes the DASD subsystem to work harder. Using the screens/reports below, it can determined if there may be paging occurring which will cause performance impacts. Reports are always good for trending, finding the time a problem started and determining 'prime time' slots.
IBR stands for Invalid but Resident. It is part of the new storage concept that replaces XSTORE (expanded storage) for
handling memory activity as of z/VM 6.3. It contains several frame/page lists.
When the system needs real storage (memory), the algorithm selects frames/pages from the user and system owned lists.
These pages are put in IBR state. Any access to a page in IBR state by guests results in revalidation. Otherwise,
the frame associated with an IBR page is added to the global aging list to be reused.
Linux servers tend to do polling which causes the server to look at data then go back to sleep. If the pages it
touches at each dispatch get paged out (moved to disk), the system page rate goes up. There are ways to adjust IBR
as a high page rate will cause system performance impacts - shown on IBR analysis.
Helpful configuration settings:
- Critical - Page space must be no more than 75% allocated! More than that, blocking factors drop and page I/O goes up.
- Paging storage should be 2 times the requirement.
- It is recommended to use consistent naming conventions for page and spool devices so they are easily identified.
- Ensure paging devices are dedicated.
- Paging devices should have multiple channel paths.
- Ensure a paging device has only page space allocated - no other kinds of data.
- Ensure paging devices are all the same size - such as 3390-3 or 3390-9, etc.
- Ensure paging devices do not exceed 20% busy. Allocate the same page space to each paging device to ensure the load is balanced at peak intervals.
- It is recommended to set the size for the global aging list to help manage pageable storage. Set the size to 5% with SET AGELIST SIZE 5%.
- If paging is an issue due to DASD speed, the use of solid state DASD (SSD) for paging devices is recommended.
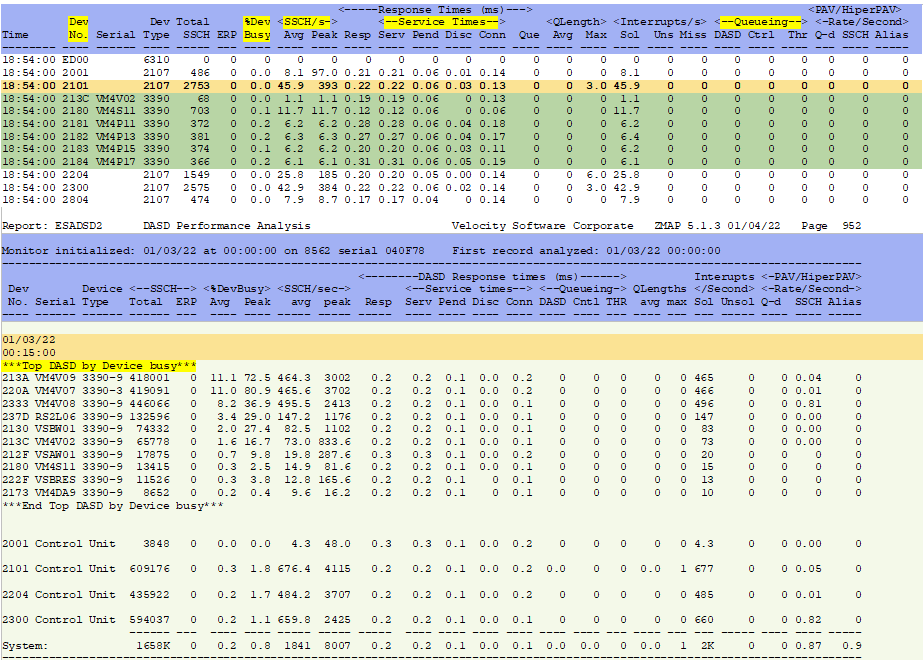
Page devices are usually in the top ten DASD so that is not necessarily an issue. If a device busy is over 20%, this is cause for concern. If a device busy is over 50%, it can indicate a serious problem. Minute by minute analysis on the ESADSD2 screen (shown below) would show a 30% peak.
Helpful ESAMON screens/ESAMAP reports (further explained below):
- ESAPAGE - Paging and Spooling Analysis - Shows paging/spooling activity.
- ESAPSDV - Page and Spool Device Activity - Shows paging/spooling configuration and utilization.
- ESADSD2 - DASD performance analysis Part 1 - Shows how the current DASD is performing.
- ESABLKP - Block Paging analysis - Shows the activity rates associated with block paging activities.
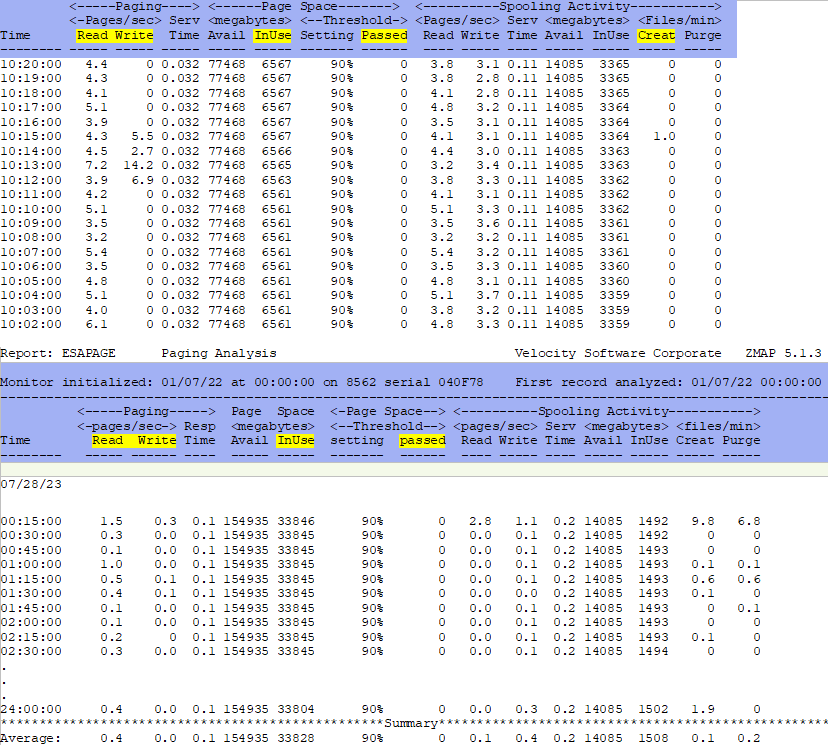
ESAPAGE - Shows paging/spooling activity. This is the easiest way to see paging activity.
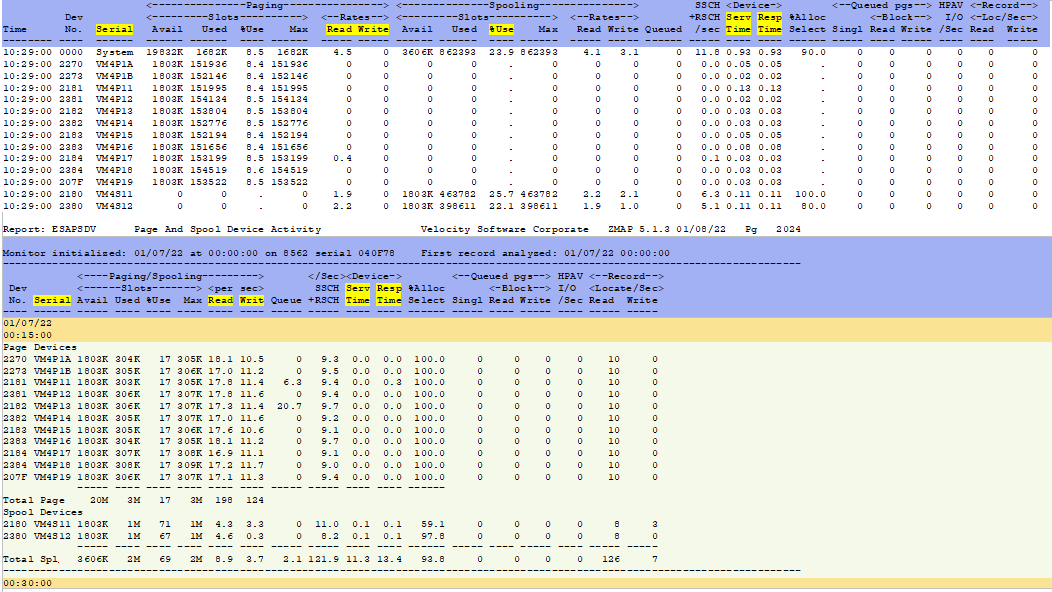
ESAPSDV - Shows paging/spooling configuration and utilization. Both screen and report samples:
ESADSD2 - Shows DASD performance. Look for the paging devices seen above. Both screen and report samples:
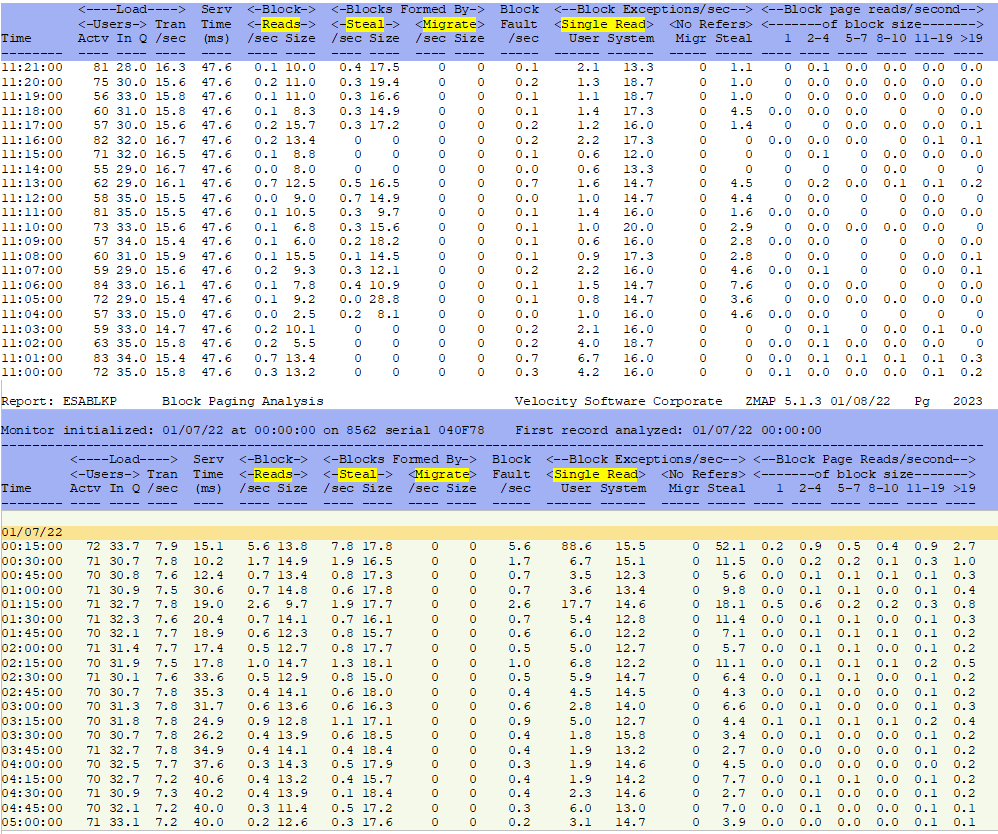
ESABLKP - Shows the block paging analysis. Both screen and report samples:
Back to top of page
Back to Flow Chart main page
