User Wait State Analysis
Examining User Wait States
Every virtual CPU is in a state. The ESAXACT screen/report shows an overall picture of the vCPU states, whether running
or waiting for some resource. One of the fastest ways to determine what is causing complaints of slow response time
is to look at ESAXACT. The wait states will indicate the resource (or resources) that are the issue. This also
points to the next step of investigation.
Note: If there is a bottleneck in Linux (or other servers/applications), the ESAXACT screen/report may not show it
clearly. So if all looks well with z/VM, check the Linux system processes - ESALNXP (or other application reports).
Background information:
- There are two forms of user state sampling - monitor sampling and high-frequency sampling.
- Monitor sampling - one time per 60 seconds (shows as System: on the ESAXACT screen or the interval time line of the
report.)
This has known inaccuracies and is harder to use based on the low frequency values that make for skewed percentages.
- High-frequency sampling - one time per second per virtual CPU (shows as Hi-Freq: on the ESAXACT report)
This data is accumulated in the user domain sample data and is based on the monitor RATE. This is preferred
and shows in all other information on the ESAXACT screen/report.
- Note: Sampling size goes up the more vcpus running per machine/server.
- It is important to understand which states are actually forms of idle time. Users in test idle are in a 300 ms queue
drop delay (test to see if they are truly idle).
Some service machines can go into SVM (Service Machine Wait) when they are in fact
idle. Linux servers tend to stay in test idle because of polling.
- Test idle is a "normal" wait state. High numbers in this column are good.
- Wait state sampling tests I/O Wait before testing Limit. If there is I/O wait, it stops further sampling.
- If something is happening inside of Linux on a Linux server, it may not show in ESAXACT.
- Numbering convention - if something is 0, there were NO occurrences. If it is 0.0, the number wasn't statistically
significant, but there was at least one occurrence.
General Guidelines on where to focus (details below):
- CPU Subsystem issues:
- When the number of machines in "Run" status goes down
- When the number of machines in "CPU" wait goes up
- When the number of machines in "Sim" wait goes up
- Paging/Memory subsystem issues:
- When the number of machines in "Pag" goes up
- A user can be running and still waiting on pages, so if these numbers are high, the wait is significant
- DASD subsystem issues:
- When the number of machines in "Asynch I/O" goes up
- When the number of machines in "SIO" goes up
- A user can be running and still waiting on I/O of some kind, so if these numbers are high, the wait is significant
- Loading - not actually a wait state, but shows the memory needs are ramping up for a server(s) and can be an
indication of a paging issue or system memory thrashing.
Note:
- If a user/server has a high amount of samples and a high "Run" number, there isn't necessarily a system issue, the
virtual machine needs more cycles. The only way to speed up its processing is to: 1) Break the workload out to run on
multiple CPUs, 2) Get a faster CPU or 3) Reduce the CPU requirements of that application.
The ESAXACT screen/report: Transaction Delay Analysis - This shows an analysis of virtual machine states and
wait states.
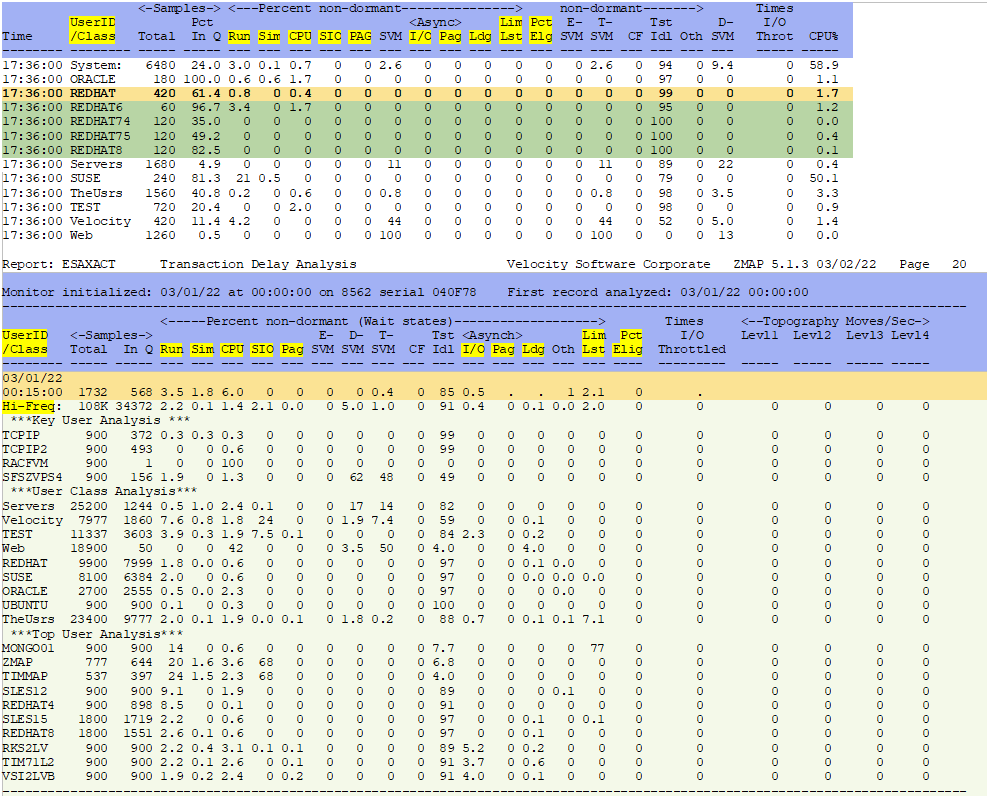
Note: For the screen - Click (zVIEW) or zoom/pF2 (z/VM) to see each user/server in a class. For the report
- Use the Top User Analysis to see the top users/servers per 15 minute interval.
UserID/Class - This shows the system total and totals for servers/classes.
Percent non-dormant Run - The percentage of virtual machines in Running state are actually dispatched and doing
work. This will number will go down as response times go up. Also, if there is a virtual machine that has a high running
number but isn't really waiting on anything, it needs more cycles, which means faster engines or spliting the
workload over more engines.
Percent non-dormant SIM - This shows the percentage of time a user/server/class is waiting for the z/VM control
program to execute (or simulate) instructions on its behalf.
This state is a function of master processor utilization and contention. The master
processor is a single threaded resource as certain functions can only run on the master processor,
such as spool, diagnose and IUCV functions. Users performing a significant amount
of these functions have high simulation wait.
SIM wait will always show up with CPU wait, but if it is high on its own - a number over
10 is excessive - then research needs to be done on the functions above.
Percent non-dormant CPU - This shows the percentage of time a user/server/class is waiting for CPU.
The virtual machine (virtual processor) is ready and waiting to be dispatched to run but there
is no physical processor currently available. A number over 20 is excessive.
If a machine has a high CPU wait, check the ESAUSR2 report to compare its CPU use to the total CPU use.
Check the CPU utilization for the system, the relative SHARE of the id. Also check the LPAR
weights/overhead.* See LPAR weights/overhead to determine if the LPAR is trying to use
more than its configured share.
Percent non-dormant SIO - This shows the percentage of time a user/class is waiting for I/O.
This is a measure of the effectiveness of I/O tuning such as the use of minidisk caching, or DASD cache.
Check the DASD and cache utilization for the system. There may be a device problem or
a cache issue.
Percent non-dormant PAG - This shows the percentage of time a user/class is waiting on needed pages that are
no longer in memory and must be read in from DASD. A number over 10 is excessive.
Check the memory/paging utilization for the system. Also reserving memory
for an id in this situation (such as - SET RESERVED id 1000) will also help.
Percent non-dormant Async I/O - This shows the percentage of time a server (multiprocessing system) is
waiting for asynchronous I/O. This state is entered when there is an outstanding I/O
and the user has loaded a wait state PSW. It occurs for guests running an
operating system such as Linux, VSE, z/OS or second-level z/VM. ESALNXF can be used to get more information on
file I/O reads/writes per ms.
Percent non-dormant Async Pag - This shows the percentage of time a server (multiprocessing system) is
waiting on paging. If a server is in this state, they are waiting for a page to be read by the system. This is also for
guests running an operating system such as Linux, VSE, z/OS or second-level z/VM.
Check the memory/paging/DASD utilization for the system.
Percent non-dormant Ldg - This shows the percentage of time a user/server/class is 'loading' if it has a
high count of page reads or if its pages were paged out. This can indicate a thrashing condition.
This is where the system is struggling to get memory resources to run machines.
Check the memory/paging/DASD utilization for the system.
Percent non-dormant Lim Lst - This shows the percentage of time a user/server/class is on the "Limit List".
This could be due to SHARE LIMIT being set or possibly a resource pool constraint.
Check SHARE size for the id, CPU utilization and/or resource pool utilization.
Percent non-dormant Pct Elig - This shows the percentage of time a user/server/class is on the eligible list
waiting to enter the dispatch list. If this number is not zero, it is not good.
The guests are waiting on some resource - check the other columns to find the
bottleneck. No longer relevant after z/VM 6.3.
Conclusions:
The ESAXACT screen is a very good way to see at a glance how the system is performing. Using the ESAXACT report, trending
or "time of day" bottlenecks can be easily seen. If more information is needed, an EXTRACT can be run - See
Extracting Performance Data Basics. Also, in zVIEW, specific time frames and user/server/class
may be entered to see a performance trend. This is extremely helpful for pinpointing when a problem started.
* Eliminating CPU wait can improve performance by 10x!
Back to top of page
Back to Flow Chart main page

