CPU on VSE Analysis
VSE CPU - Best Practices
Helpful processing information:
- Processing configuration:
- VSE supports up to 10 CPUs, but the practical limit is much less. Usually one or two is sufficient.
- The more non-parallel work that is being done, the greater the possibility that value would be added by having
an additional CPU.
- The non-parallel share will be highly dependent on the workload.
Helpful ESAMON screens/ESAMAP reports:
- ESAVSEC - VSE System Performance - Shows information about the performance of the VSE system.
- ESAVSEC2 - VSE System Performance - Shows information about the performance of the VSE system per CPU.
- ESAVSEP - VSE Partition Performance - Shows information about the CPU usage of running jobs and job phases.
- ESAVSEJ - VSE Job/Step Performance - Shows information about the CPU usage of running jobs and job phases.
- ESAXACT - Transaction Delay Analysis - This shows an analysis of virtual machine states and wait states.
Using zVPS to find information for solving issues with the VSE CPU:
ESAVSEC - Shows information about the performance of the VSE system.
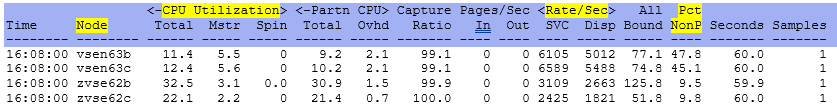
Node - This shows the node name of the server.
CPU Utilization Total - This shows the percentage of CPU spent for both parallel and non-parallel work from a
VSE perspective.
CPU Utilization Mstr - This shows the percentage of CPU spent for non-parallel work.
CPU Utilization Spin - This shows the percentage of CPU spent waiting for resources occupied by another task.
Partn CPU TOTal - This shows the CPU used accumulated from running jobs.
Partn CPU Ovhd - This shows the CPU overhead accumulated from running jobs.
Rate/Sec SVC - This shows the VSE system operations - number of SVCs per second.
Rate/Sec DSP - This shows the VSE system operations - number of Dispatcher Cycles per second.
Pct NP - This shows the Non-Parallel share percentage. This is helpful to know if multiple CPUs are useful.
The lower the number, the more CPUs can be used for the workload.
Note: Clicking on a Node line (zview) or zoom (z/VM) will show the ESAVSEC2 information per CPU.
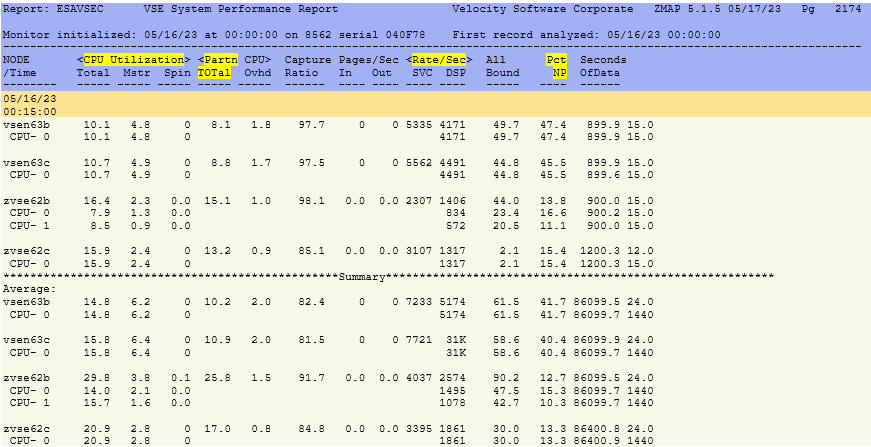
ESAVSEC2 - Shows information about the performance of the VSE system per CPU.
Node - This shows the node name of the server.
Rate/Sec SVC - This shows the VSE system operations - number of SVCs per second.
Rate/Sec DSP - This shows the VSE system operations - number of Dispatcher Cycles per second.
CPU Utilization Total - This shows the percentage of CPU spent for both parallel and non-parallel work.
CPU Utilization Mstr - This shows the percentage of CPU spent for non-parallel work.
CPU Utilization Spin - This shows the percentage of CPU spent waiting for resources occupied by another task.
Pct NP - This shows the Non-Parallel share percentage. This is helpful to know if multiple CPUs is useful.
The lower the number, the more CPUs can be used for the workload.
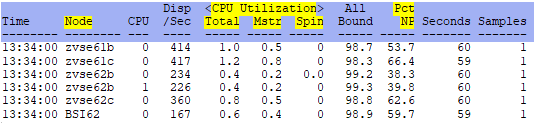
ESAVSEP - Shows information about the CPU performance of the VSE partition.
Node - This shows the node name of the server.
Part ID - This shows the VSE partition.
Job Name - This shows the name of a running job or Totals. Can click on a line (zview) or zoom (z/VM) to see
all the job steps that ran.
Phase Name - This shows the name of the phase in the running job.
CPU% CPU - This shows the CPU usage for the partition.
CPU% Ovhd - This shows the CPU overhead for the partition. (These two numbers will add up to the CPU Total
on ESAVSEC screen.)
Job Num - This shows the POWER job number.
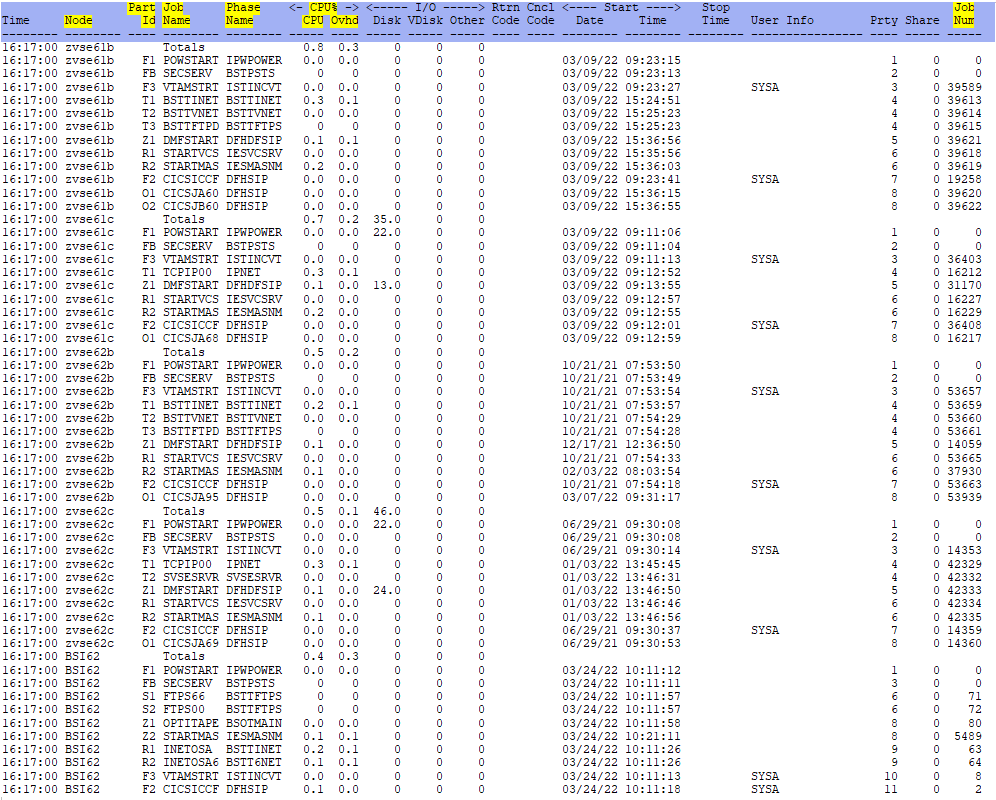
ESAVSEJ - Shows information about the CPU performance of the VSE running jobs and job phases.
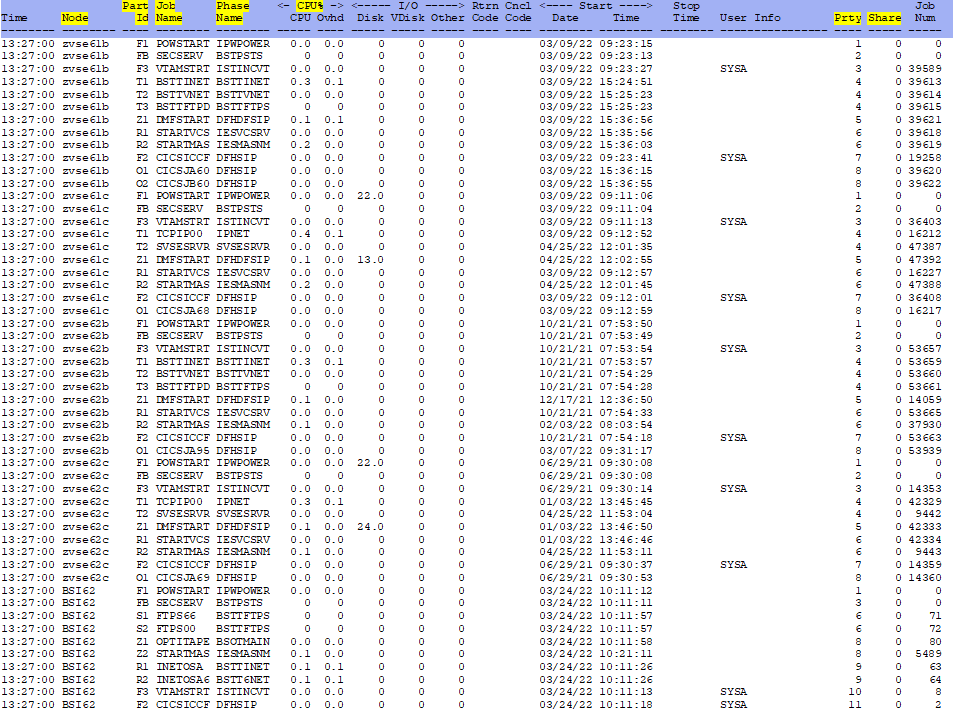
Node - This shows the node name of the server.
Part ID - This shows the VSE partition.
Job Name - This shows the name of a running job or Totals.
Phase Name - This shows the name of the phase in the running job.
CPU% CPU - This shows the CPU usage for the partition.
CPU% Ovhd - This shows the CPU overhead for the partition. (These two numbers will add up to the CPU Total
on ESAz/VSEC screen.
Prty - This shows the relative partition priority with one being the highest.
Share - If the partition is in a balanced group, this shows the relative share for the partition in the group.
ESAXACT - Shows virtual machine state and wait state analysis information.
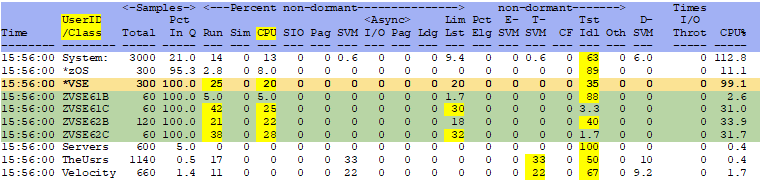
Percent non-dormant CPU - This shows the percentage of time a user/server/class is waiting for CPU.
The virtual machine (virtual processor) is ready and waiting to be
dispatched to run but there is no physical processor currently available. A number
over 20 is excessive. Check the LPAR weights/overhead.
See LPAR weights/overhead
Conclusions
The percentage of non-parallel work will help show how many CPUs the system can use efficiently. The wait state times
for CPU will show if any VSE virtual machines are waiting on CPU. Tracking these two statistics via the ESAMON screens
(in the moment) and the reports (trending/peak periods) will help determine where the CPU configuration is the most
efficient.
Back to top of page
Back to Performance Tuning Guide

