z/OS Resource Analysis
z/OS Resources - Best Practices
Helpful processing information:
Helpful ESAMON screens/ESAMAP reports:
- ZOSJDSD - z/OS Job/Step DASD/Resource Report - This shows CPU utilization, I/O and paging metrics by Jobname,
JES Identifier and Service Class.
- ZOSJWKLD - z/OS Service Class Workloads Report - This shows resource activity information by Service Class.
- ZOSJSTR - z/OS Job/Step Storage Report - This shows various memory and paging information.
- ZOSJCPU - z/OS Job/Step CPU Resource Analysis - This shows CPU and memory information.
- ZOSPAGE -z/OS Page Dataset Detail Report - This shows details about z/OS page datasets.
- ZOSJUSS - z/OS Job/Step Unix System Services Report - This shows the various Unix process metrics.
Using zVPS to find information for solving issues with the z/OS Resources:
ZOSJDSD - Shows information about the z/OS Job/Step resource usage.
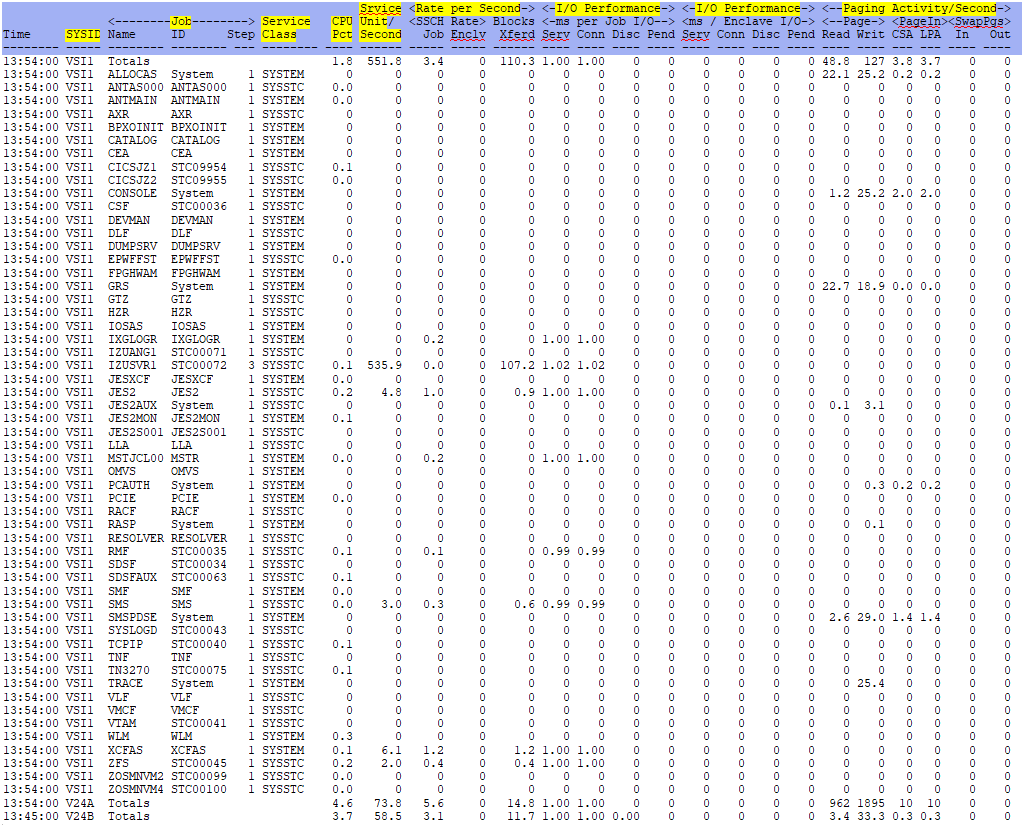
SYSID - This shows the system name as defined in the parmlib member IEASYSxx SYSNAME.(SMF30SID)
Job Name - This shows the job name.(SMF30JBN)
Job ID - This shows the JES job identifier.(SMF30JNM)
Job Step - This shows the job step number.(SMF30STN)
Service Class - This shows the service class name.(SMF30SCN)
CPU Pct - This shows the percent CPU utiliztion - includes all components of CPU step time. ZOSJCPU will
show each individual component.
See z/OS CPU Performance
Srvice Unit/Second - This shows the I/O service units per second.(SMF30IO)
Rate per Second Job - This shows the DASD I/O start subchannel for address space plus dependent
enclaves.(SMF30AIS)
Rate per Second Enclv - This shows the DASD I/O start subchannel for independent enclaves.(SMF30EIS)
Rate per Second Blocks Xferd - This shows the total blocks transferred (accumulates EXCP counts).
(SMF30TEX)
I/O Performance per Job I/O Serv - This shows the DASD I/O service time - including connect, disconnect
and pending time for the job address space plus dependent enclaves.
I/O Performance per Job I/O Conn - This shows the DASD I/O connect time.(SMF30AIC)
I/O Performance per Job I/O Disc - This shows the DASD I/O disconnect time.(SMF30AID)
I/O Performance per Job I/O Pend - This shows the DASD I/O pending time.(SMF30AIW)
I/O Performance per Enclave I/O Serv - This shows the DASD I/O service time - including connect, disconnect
and pending time for the independent enclaves owned by the address space.
I/O Performance per Enclave I/O Conn - This shows the DASD I/O connect time.(SMF30EIC)
I/O Performance per Enclave I/O Disc - This shows the DASD I/O disconnect time.(SMF30EID)
I/O Performance per Enclave I/O Pend - This shows the DASD I/O pending time.(SMF30EIW)
Paging Activity/Second Page Read - This shows the pages that were paged in from auxiliary memory.(SMF30PGI)
Paging Activity/Second Page Writ - This shows the pages that were paged out to auxiliary memory.(SMF30PGO)
Paging Activity/Second PageIn CSA - This shows the common area page-ins (LPA+CSA) from auxiliary memory to
central memory.(SMF30CPI)
Paging Activity/Second PageIn LPA - This shows the LPA page-ins from auxiliary memory to central memory.
(SMF30LPI)
Paging Activity/Second SwapPgs In - This shows the pages swapped in from auxiliary memory to central memory.
(SMF30PSI)
Paging Activity/Second SwapPgs Out - This shows the pages swapped out from central memory to auxiliary memory.
(SMF30PSO)
ZOSJWKLD - Shows information about the z/OS Job/Step resource usage.
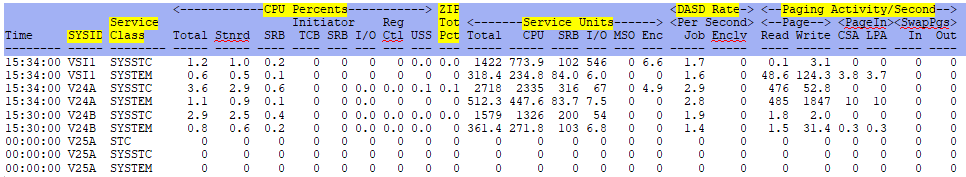
SYSID - This shows the system name as defined in the parmlib member IEASYSxx SYSNAME.(SMF30SID)
Service Class - This shows the service class name.(SMF30SCN)
CPU Percents Total - This shows the total CPU utilization for all components (SMF30CPT/CPS/ICU/ISB/IIP/RCT/HPT).
CPU Percents Stnrd - This shows the percent of standard CPU step time which includes enclave, pre-emptable,
client SRB time and zIIP eligible work running on a GP.(SMF30CPT)
CPU Percents SRB - This shows the percent of CPU running under SRB.(SMF30CPS)
CPU Percents Initiator TCB - This shows the percent of initiator CPU running under TCB.(SMF30ICU)
CPU Percents Initiator SRB - This shows the percent of initiator CPU running under SRB.(SMF30ISB)
CPU Percents I/O - This shows the percent of CPU used to process I/O interrupts.(SMF30IIP)
CPU Percents Reg Ctl - This shows the percent of CPU used by the region control task.(SMF30RCT)
CPU Percents USS - This shows the percent of CPU used by UNIX System Services which includes both standard CPU
and SRB times.(SMF30OST)
ZIP Tot Pct - This shows the percent of general CPU on the zIIP, including enclave.
Service Units Total - This shows the total service units.(SMF30SRV)
Service Units CPU - This shows the CPU service units.(SMF30CSU)
Service Units SRB - This shows the SRB service units.(SMF30SRB)
Service Units I/O - This shows I/O service units.(SMF30IO)
Service Units MSO - This shows the main memory occupancy service units.(SMF30MSO)
Service Units Enc - This shows the independent enclave CPU service units.(SMF30ESU)
DASD Rate Per Second Job - This shows the DASD I/O start subchannel count for address space plus dependent
enclaves.(SMF30AIS)
DASD Rate Per Second Enclv - This shows the DASD I/O start subchannel count for independent enclaves.(SMF30EIS)
Paging Activity/Second Page Read - This shows the pages paged in from auxiliary memory.(SMF30PGI)
Paging Activity/Second Page Write - This shows the pages paged out to auxiliary memory.(SMF30PGO)
Paging Activity/Second PageIn CSA - This shows the common area page-ins (LPA+CSA) from auxiliary memory to
central memory.(SMF30CPI)
Paging Activity/Second PageIn LPA - This shows the LPA page-ins from auxiliary memory to central memory.
(SMF30LPI)
Paging Activity/Second SwapPgs In - This shows pages swapped in from auxiliary memory to central memory.
(SMF30PSI)
Paging Activity/Second SwapPgs Out - This shows pages swapped out from central memory to auxiliary memory.
(SMF30PSO)
ZOSJSTR - Shows information about the z/OS Job/Step memory usage.
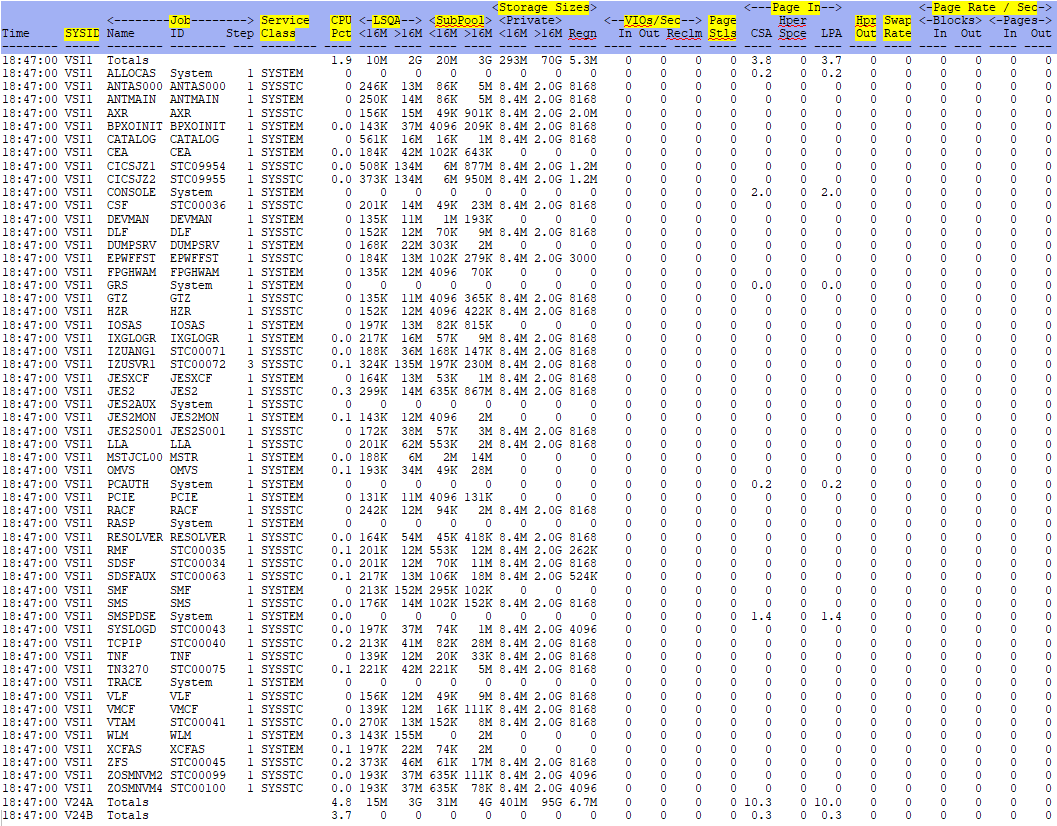
SYSID - This shows the system name as defined in the parmlib member IEASYSxx SYSNAME.(SMF30SID)
Job Name - This shows the job name.(SMF30JBN)
Job ID - This shows the JES job identifier.(SMF30JNM)
Job Step - This shows the job step number.(SMF30STN)
Service Class - This shows the service class name.(SMF30SCN)
CPU Pct - This shows the percent CPU utiliztion - includes all components of CPU step time. ZOSJCPU will
show each individual component.
See z/OS CPU Performance
LSQA <16M - This shows the Local System Queue Area (LSQA) and Scheduler Work Area (SWA) subpools maximum
virtual memory allocated
(in bytes) under the 16M line.(SMF30ARB)
LSQA >16M - This shows the Local System Queue Area (LSQA) and Scheduler Work Area (SWA) subpools maximum
virtual memory allocated
(in bytes) above the 16M line.(SMF30EAR)
Subpool <16M - This shows the user subpools maximum virtual memory allocated (in bytes) under the 16M line.
(SMF30URB)
Subpool >16M - This shows the user subpools maximum virtual memory allocated (in bytes) above the 16M line.
(SMF30EUR)
Storage Sizes Private <16M - This shows the private area size (in bytes) under the 16M line.(SMF30RGB)
Storage Sizes Private >16M - This shows the private area size (in bytes) above the 16M line.(SMF30ERG)
Storage Sizes Private Regn - This shows the region size established in 1K units.(SMF30RGN)
VIOs/Sec In - This shows the Virtual I/O page-ins from auxiliary memory to central memory that includes
page-ins resulting from page faults or specific page requests on a VIO window. It does not include VIO swap-ins or page-ins
for the common area.(SMF30VPI)
VIOs/Sec Out - This shows the Virtual I/O page-outs from central memory to auxiliary memory that includes
page-outs resulting from specific page requests
on a VIO window as well as those pages stolen by the paging supervisor through
infrequent use. It does not include VIO swap-outs or page-outs for the common area.(SMF30VPO)
Page Stls - This shows the pages stolen from this address space.(SMF30PST)
Page In CSA - This shows the number of page-ins in the Common area (LPA+CSA) from auxiliary memory to central
memory.(SMF30CPI)
Page In Hper Spce - This shows the number of page-ins in Hiperspace from auxiliary to processor memory.
(SMF30HPI)
Page In LPA - This shows the number of page-ins in LPA from auxiliary memory to central memory.(SMF30LPI)
Hpr Out - This shows the number of hiperspace page-outs from processor to auxiliary memory.(SMF30HPO)
Swap Rate - This shows the address space swap sequences. A swap sequence consists of an address space swap-out
and swap-in. Logical swap-out and swap-in are not included.(SMF30NSW)
Page Rate/Sec Blocks In - This shows the number of blocks paged in from auxiliary memory.(SMF30KIA)
Page Rate/Sec Blocks Out - This shows the number of blocks paged out to auxiliary memory.(SMF30KOA)
Page Rate/Sec Pages In - This shows the number of blocked pages paged in from auxiliary memory.(SMF30BIE)
Page Rate/Sec Pages Out - This shows the number of blocked pages paged out to auxiliary memory.(SMF30BOA)
ZOSJCPU - Shows information about the z/OS Job/Step CPU use, service unit rates and memory in CPU percentages.
(Picture highlights one system completely, totals only shown for the other two systems)
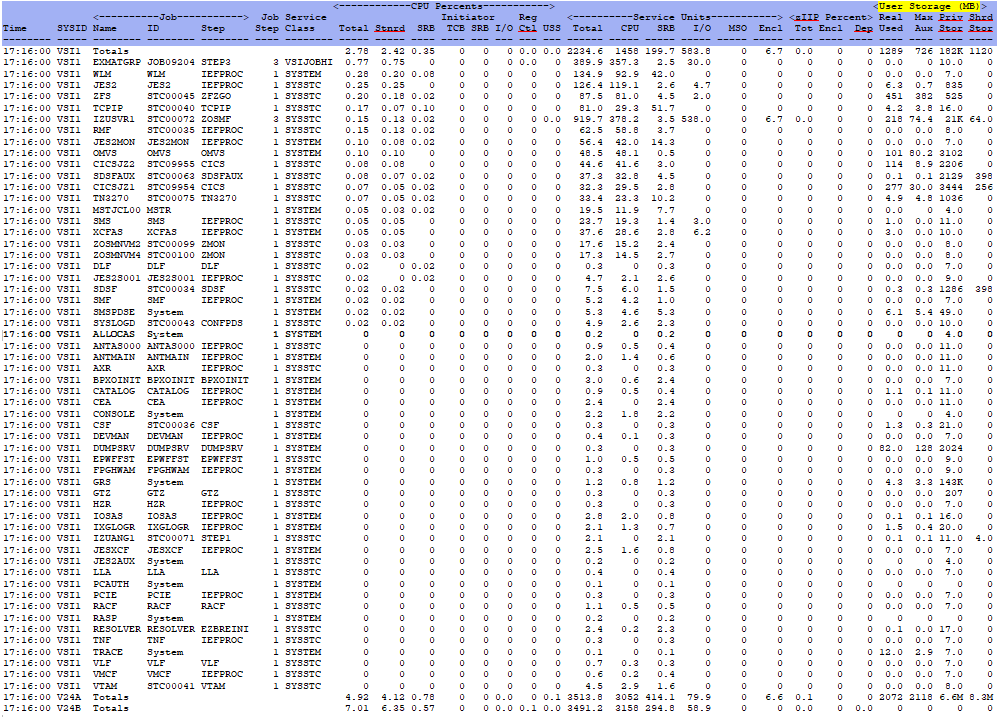
SYSID - This shows the system name as defined in the parmlib member IEASYSxx SYSNAME (SMF70SNM).
Job Name - This shows the job name.(SMF30JBN)
Job ID - This shows the JES job identifier.(SMF30JNM)
User Storage - Real Used - This shows the high water mark of real memory used to back 64-bit private memory.
(SMF30HVR/256)
User Storage - Max Aux - This shows the high water mark of auxiliary memory used to back 64-bit private memory.
(SMF30HVA/256)
User Storage - Priv Stor - This shows the amount of 64-bit private memory obtained by this step or job, including
guarded virtual memory.(SMF30HVO/1024/1024)
User Storage - Shar Stor - This shows the amount of 64-bit shared memory this step/job has access or
addressability.(SMF30HSO/1024/1024)
ZOSPAGE - Shows information about the z/OS page datasets. The fields come from the CICS SMF data - record type 75,
subtype 1.
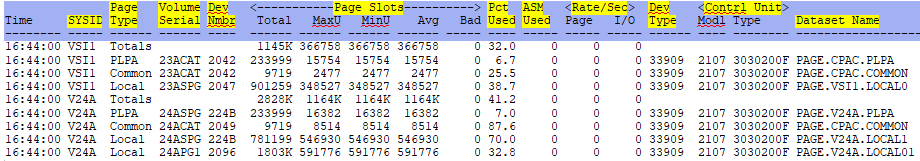
SYSID - This shows the system ID of z/OS.(SMF75SID)
Page Type - This shows a flag byte that describes the dataset type.(SMF75PST)
Volume Serial - This shows the volume serial where the dataset is catalogued.(SMF75VOL)
Dev Nmbr - This shows the device number of the page dataset.(SMF75CHA)
Page Slots Total - This shows the total number of page slots contained within the page dataset.(SMF75SLA)
Page Slots MaxU - This shows the maximum number of slots used.(SMF75MXU)
Page Slots MinU - This shows the minimum number of slots used.(SMF75MNU)
Page Slots Avg - This shows the average number of slots used.(SMF75AVU)
Page Slots Bad - This shows the number of unusable page slots.(SMF75BDS)
Pct Used - This shows a calculated value that shows the percentage of average used slots compared to total slots.
((SMF75AVU/SMF75SLA)*100))
Asm Used - This shows the number of samples indicating that the dataset was being used by ASM.(SMF75USE)
Rate/Sec Page - This shows the number of pages transferred to or from the page dataset expressed as a rate.
(SMF75PGX/seconds)
Rate/Sec I/O - This shows the number of I/O requets for the dataset expressed as a rate.(SMF75SIO/seconds)
Dev Type - This shows the device type on which the page dataset is contained.(SMF75DEV)
Control Unit Modl - This shows the control unit model number.(SMF75CU)
Control Unit Type - This shows the control unit type.(SMF75TYP)
Dataset Name - This shows the page dataset name.(SMF75DSN)
ZOSJUSS - Shows information about the z/OS Unix process metrics.
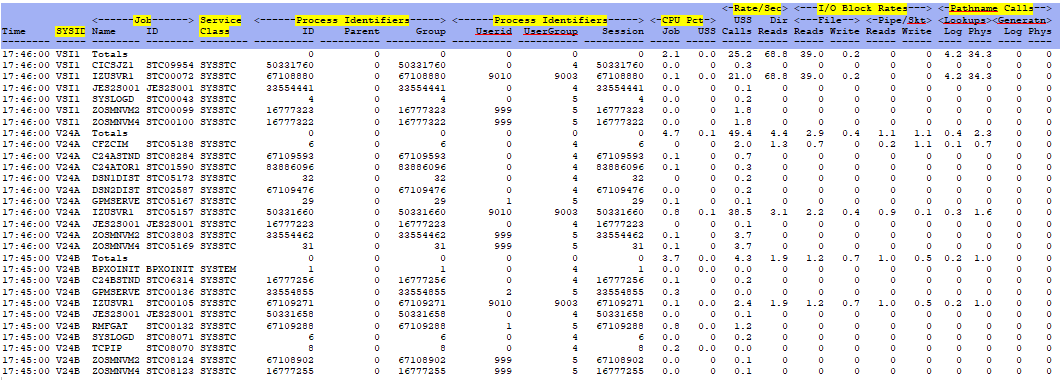
SYSID - This shows the system name as defined in the parmlib member IEASYSxx SYSNAME.(SMF30SID)
Job Name - This shows the job name or totals for the system totals.(SMF30JBN)
Job ID - This shows the JES job identifier.(SMF30JNM)
Service Class - This shows the service class name.(SMF30SCN)
Process Identifiers ID - This shows the process ID.(SMF30OPI)
Process Identifiers Parent - This shows the parent process ID.(SMF30OPP)
Process Identifiers Group - This shows the process group ID.(SMF30OPG)
Process Identifiers Userid - This shows the process user ID.(SMF30OUI)
Process Identifiers UserGroup - This shows the process user group ID.(SMF30OUG)
Process Identifiers Session - This shows the process session ID.(SMF30OSI)
CPU Pct Job - This shows the percent CPU utiliztion - includes all components of CPU step time. ZOSJCPU will
show each individual component.
Tht Totals line represents CPU time for all the jobs in the interval, not just the jobs
that used USS.
See z/OS CPU Performance
CPU Pct USS - This shows the CPU used by UNIX System Services. This value includes both standard CPU and SRB
times.(SMF30OST)
Rate/Sec USS Calls - This shows the z/OS UNIX services requested by the process.(SMF30OSC)
Rate/Sec Dir Reads - This shows the directory reads for the process.(SMF30ODR)
I/O Block Rates File Reads - This shows the z/OS UNIX regular file read I/O block rate.(SMF30OFR)
I/O Block Rates File Write - This shows the z/OS UNIX regular file write I/O block rate.(SMF30OFW)
I/O Block Rates Pipe/Skt Reads - This shows the z/OS UNIX pipes and AF_UNIX sockets read I/O block rate.
(SMF30OPR)
I/O Block Rates Pipe/Skt Write - This shows the z/OS UNIX pipes and AF_UNIX sockets write I/O block rate.
(SMF30OPW)
Pathname Calls Lookups Log - This shows the pathname lookup calls to the logical file system per second.
(SMF30OLL)
Pathname Calls Lookups Phys - This shows the pathname lookup calls to the physical file system per second.
(SMF30OLP)
Pathname Calls Generatn Log - This shows the pathname generation calls to the logical file system per second.
(SMF30OGL)
Pathname Calls Generatn Phys - This shows the pathname generation calls to the physical file system per second
to determine a pathname.(SMF30OGP)
Back to top of page
Back to Performance Tuning Guide

