System Configuration Analysis
System Configuration Analysis
Step one is knowing the system configuration - which consists of understanding the hardware, system settings, user/server
composition, etc. Important information is sometimes missed - like believing the system is using IFL's but it actually is
not, or the default of a setting changed and was not realized. The ESAHDR screen/report has a general view of the entire
system and is a great place to look to verify general settings. The ESAUSRC screen/report has detailed information about
how virtual machines/servers are set up.
Setting up the system SHARE for a virtual machine can make a huge difference in performance.
- Relative vs absolute SHARE - Relative 100 is the default. A more 'important' machine may need an absolute share.
- Hard/Soft Limits - These can be tricky, use with caution.
- How many virtual CPUs are involved - if multiple vcpus are define, then need change the SHARE accordingly.
Another part of the system configuration is how the CP Monitor data is configured. Things like - depending on the
environment, seek data should be turned off or there will be way too many monitor records.
This is a good presentation on the CP Monitor.
Helpful ESAMON screen/ESAMAP reports:
- ESAHDR - System configuration - shows the CPU hardware configuration and some performance information.
- ESAUSRC - User configuration - shows virtual machine configuration for all users.
ESAHDR screen - Shows the hardware configuration.
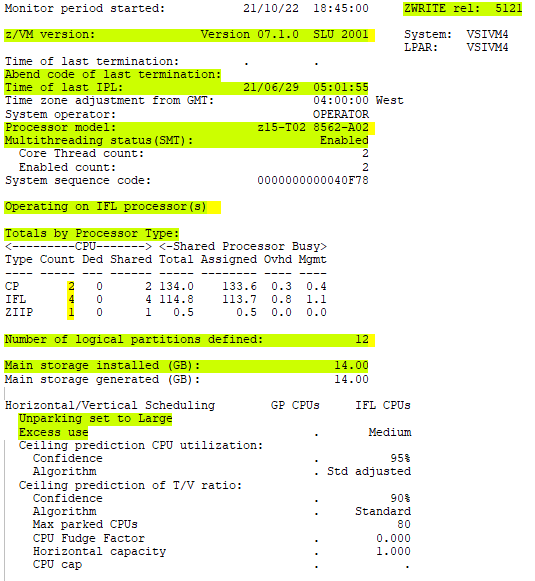
zVPS version - The current version of the Velocity product. Hopefully is current!
z/VM version - The current version and update level of the z/VM system. Knowing the system level helps determine
what new (or old) settings are available.
Abend code at last termination - This shows an abend code if the system was lost and/or auto-IPL'd.
TOD clock at last IPL - This shows the date/time when this LPAR was last IPL'd.
Processor model - The current CEC box model (z15 T02) and engine count/speed for GP engines (8562-A02).
Multithreading status - Shows information about multithreading - if enabled and if so, how many threads.
Having SMT enabled changes how to look at utilization.
See SMT Analysis for more information.
Operating on IFL processors - This says IFL processors are present. If expecting IFLs, be sure they are
being used.
CPU Count - This box has seven physical CPUs (CPs) - two general CP's, four IFL CP's and one zIIP CP.
This also shows of the four IFL engines, 114% or a little over one engine is in use.
Number of logical partitions defined - This shows the number of logical partitions defined in the box.
This box has 12 different partitions set up for different systems/workloads.
Main storage - This box has 14G of main storage (memory). Paging/Storage screens show how this memory
is being utilized.
Unparking set to Large - This shows the System Resource Manager (SRM) setting for the unparking of CPUs on an
LPAR. Velocity recommends setting parking to Large.
(Large is the default in z/VM 7.1, changes to Medium in z/VM 7.2.)
See: CPU/LPAR Parking for more information.
Excess use - This is the SRM setting for how aggressively the system should attempt to use unentitled CPU
capacity. (Medium is the default.)
Velocity recommends setting excessuse IFL high.
ESAHDR (zmap report) - Shows the hardware configuration plus daily general performance.
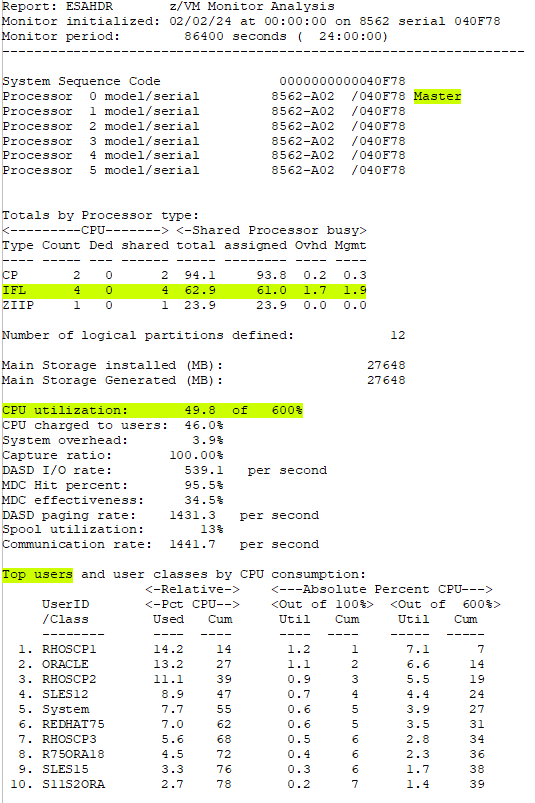
The ESAHDR report shows all the same static information as the ESAHDR screen. However, it also adds some dynamic
information totaled for each day that can be extremely helpful.
Master - This shows which of the processors is the master processor. This is important to know as there are
processes that can only run on the master processor.
Totals by Processor type - This shows the amount of shared and dedicated processors by type (same as the screen)
and the total processor busy for the day.
This is a good thing to track over time.
CPU utilization - This shows the total amount of CPU that was utilized (out of the percent allocated). This
indicates how busy the system was averaged over the day.
(ESAMAIN shows this information in real time).
Top users and user classes by CPU consumption - This shows the top users for the day. This can be helpful
when monitoring users over time. (ESAUSRS shows this information in real time).
The absolute percent can be helpful to see how many vCPUs worth of processing
is being used by any of the top users.
Note: There is also a section that shows each class and the members of each class. This shows at a glance how
the users/servers have been set up.
All of this can be very helpful for problem determination, and especially trending.
ESAUSRC - Shows user configuration
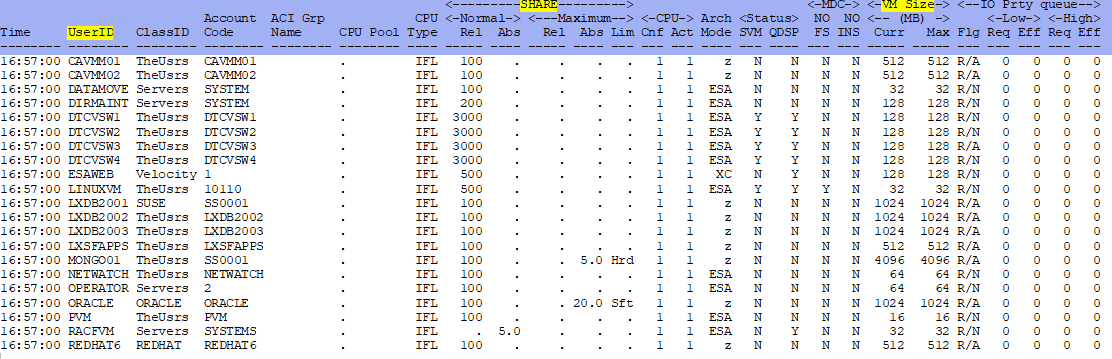
UserID/Class - This shows the UserID of the virtual machine.
SHARE - This shows the SHARE settings for each virtual machine. Watch REL vs ABS. A SHARE of REL 100 is the
default. If a machine is given more than one vCPU,
the SHARE is split equally between each. So if a machine has a setting of REL 100 but
has two vCPUs, each vCPU would get a SHARE of REL 50.
Verify that the correct machines have the correct SHARE settings/limits. See Setting SHARE Values
for Virtual Machines for more information about setting SHARE values.
VM Size - This shows the amount of memory for each virtual machine. Watch for extra large memory settings.
When a machine with extra large memory settings
logs on, it can cause the system to page. Also verify that the total amount of
memory for the users doesn't go high above the total system allocation.
MDC - This shows if minidisk caching is on or off. ZWRITE virtual machine NEEDS MDC Y!
Conclusions:
Knowing the environment configuration is extremely helpful when a performance problem appears. This allows abnormalities
to show up more easily.
Back to top of page
Back to Performance Tuning Guide

