
Memory Analysis
Memory (was storage)* is a very important part of the system. Understanding memory utilization is critical and will depend greatly on workload. Defining memory varies with traditional CMS workloads and Linux workloads. There are three types of memory on the z/VM system:
- CP Fixed Memory - Nucleus, Page Table Resource Manager (128) - This is a fixed amount of space, however, the larger the amount of LPAR memory, the bigger this will be.
- CP Non-Pageable Memory - Control blocks, Buffers - This is mostly based on workload.
- Dynamic Paging Area (DPA) - This is the rest of memory that is pageable and is the workload.
*In z/VM, the words storage and memory are used interchangably. However, on other platforms this can cause confusion. Therefore, the word storage (often confused with disk storage) has been changed to the word memory in this Tuning Guide.
Basic Memory Management:
- The system tests pages to determine if they will be needed (don't know if a server is actually doing work or not)
- Once a page is referenced, it goes to the top of the frame list and is not eligible to be put on the Invalid But Resident (IBR) list. All pages on the age list are based on a timestamp of when they were last referenced.
- The bottom of the age list gets marked as IBR - they haven't been referenced, but they are still available.
- If pages on the IBR list haven't been referenced in a certain period, they are then paged out.
- User Resident memory consists of Active memory + IBR memory + Agelist memory.
For more information about IBR, see IBR Analysis.
Paging happens when memory/storage is not available and data has to be written to disk. It is much more efficient to use memory instead of disk, plus it improves response times. Paging can cause severe system performance issues. The amount of total memory, the size of the Dynamic Paging Area (DPA) and the size/type of paging disks all come into play for the most efficient performance of the system. One of the top reasons for a first-time installation having a z/VM outage is from lack of proper page space planning. If running out of page space, the system will take a PGT004 abend. If the system starts paging at a high rate - check ESASTR1 to see what changed.
For more information about paging, see System Page analysis.
Linux and Memory:
- Memory over-commit used to be a good way to reduce costs. Now, especially with Linux, it is no longer a valid metric.
- Linux uses a 'round robin' style of paging - calling the least recently used first, however z/VM has most likely already moved that page to disk.
- Linux tries to cache as much as possible. This is helpful on a server but not on z/VM. Managing the memory size for Linux systems is important (it doesn't need to be huge).
- Linux uses memory for its own internal memory tables. When making a Linux server extra large, it needs that much more memory for those tables.
- If Linux memory is an issue, consider using zVRM
For a presentation on the Storage/Paging environment and utilization, see z/VM Storage Analysis and Tuning
Helpful configuration settings:
- Memory requirements should be reduced as much as possible to avoid unnecessary paging delays. Plan on 2GB of
memory for z/VM, MDC and infrastructure (TCPIP/DIRMAINT/zVPS).
Review options for reducing memory requirements BEFORE analyzing or enhancing the paging subsystem. Often if memory is added when not necessarily needed, CPU will go up as work is not being delayed by paging. Watch batch windows for any work delays during high utilization. - Linux - the over-commit ratio is the planning target. IE - For 20 Linux servers at 1GB each with a target over-commit
ratio of 2, 12GB will be required.
For WAS and Domino environments, an over-commit target of 1.5 is reasonable. For Oracle and other virtual friendly applications, an over-commit of 3 is reasonable.
(# of servers x server size / 2 plus 2GB for z/VM = memory requirement) - If adding more Linux servers, decrease the Linux server memory size until they start to swap. This is an easy tuning knob available to improve memory utilization!
- It is recommended to set the size for the global aging list to help manage pageable memory. Set the size to 5% with SET AGELIST SIZE 5%.
- If paging is an issue due to DASD speed, the use of solid state DASD (SSD) for paging devices is recommended.
- Recording account data uses a lot of memory - it can be turned off in the SYSTEM CONFIG or with CP RECORDING ACCOUNT OFF PURGE.
- Another space saving setting is to limit the Trace Table size with CP SET TRACEFRAMES MASTER 100 ALTERNATE 75 PERCENT.
- Minidisk Cache (MDC) defaults to 'all of it', set it down (ZVPS does use MDC!) using SET MDC STORAGE 128M 1282M
- Minidisks used for Linux file systems and for swap should have MDC turned OFF to avoid redundant levels of caching.
- It is a very good idea to set up an alerts for page space in use and rate. Page space should alert if over 70%. Page rate will be based on your paging subsystem. (ie - if 1 device, rate of 1000, if 100 devices, 100,000). This needs quick action or the system will crash if it runs out of page space.
The memory/storage subsystem analysis should be done top down:
- z/VM - how the overall system is set up/running - ESASTR1.
- Virtual machines - how users/servers are set up/running - ESAUSPG.
- VDISK/Address spaces - how the system processes are set up/running - ESAVDSK/ESAASPC.
- Linux servers/processes - how the Linux servers are running - ESALNXP/ESAUCD2.
- zVPS captures 99% of all memory data, so the reports are very accurate!
Helpful ESAMON screens/ESAMAP reports:
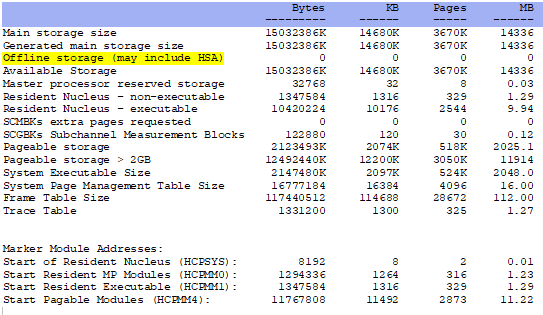
- ESASTRC - Main Storage Configuration - Shows the configuration information for the main memory area.
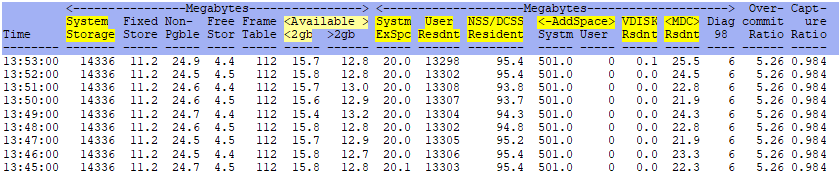
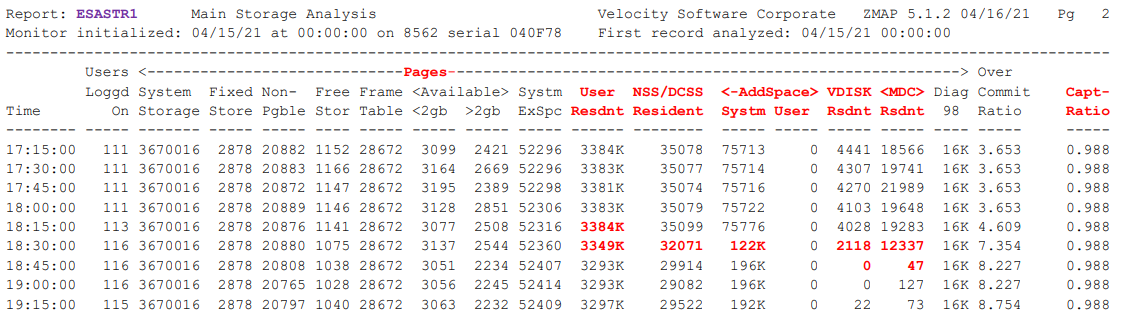
- ESASTR1 - Main Storage Analysis - Shows information about the dynamic paging area.
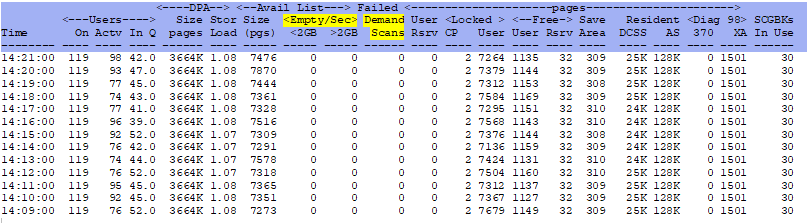
- ESASTR2 - Main Storage DPA Analysis - Shows additional information about the dynamic paging area.
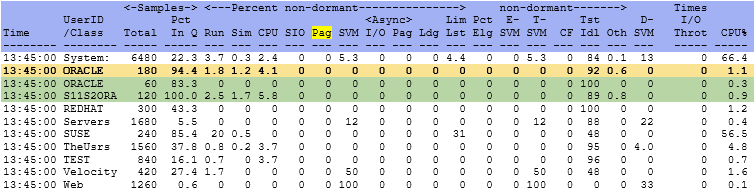
- ESAXACT - Transaction delay analysis - shows an analysis of virtual machine states and wait states.
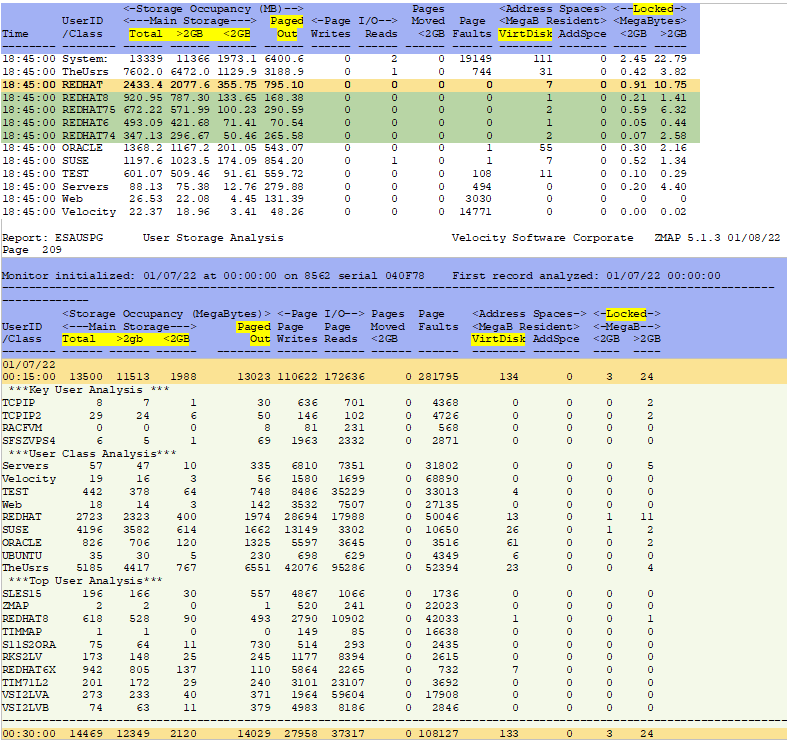
- ESAUSPG - User Storage Analysis - Shows information about user memory utilization.
Using zVPS to find information for solving issues with the storage/paging level:
ESASTRC - Shows storage configuration information.
ESASTR1 - Shows storage analysis information. This shows all of the system storage with 99% accuracy. If the system is paging, look here first.
ESASTR1 Example - This shows an example of when a large server logged on and caused a storage problem.
ESASTR2 - Shows additional storage analysis information.
ESAXACT - Transaction delay analysis. This can show if users are waiting on paging operations. Helpful storage/paging information:
ESAUSPG - Shows user storage information. Both screen and report samples:
Conclusions
Review the options for reducing storage requirements before analyzing or enhancing the paging subsystem. Many times storage requirements can be reduced so that paging requirements drop significantly. If this is the case, any time spent on the paging subsystem will be wasted. Spooling rarely impacts performance. Have sufficient number of spool volumes to keep the device busy at less than 20% during peak periods.
Back to top of page
Back to Performance Tuning Guide
