User CPU Analysis
Specifics - User CPU utilization analysis:
Looking at CPU utilization for users, the following screens/reports can show quickly where to look for more details.
Helpful ESAMON screens/ESAMAP reports (further explained below):
- ESAUSP2 - User Percent Utilization - shows virtual machine percent utilization of processor/storage/page/spool.
- ESAUSP5 - User SMT CPU Percent Utilization - shows CPU utilization in an SMT environment.
- ESAXACT - Transaction Delay Analysis - shows virtual machine wait states.
- ESAUSRD - Virtual Machine Diagnose Analysis - shows by user/class what diagnose commands are being done.
- ESATOPU - Top Users Resource Use - shows by minute the top user of resources.
- ESAUSER - User-Specific Analysis - shows information for a particular user.
ESAUSP2 - Shows user percentage utilization
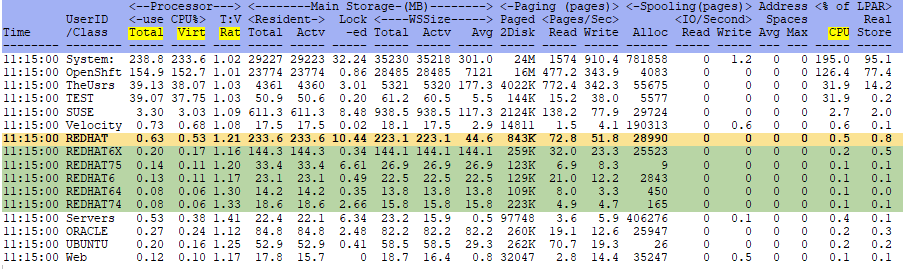
UserID/Class - This shows the classes and/or UserID's. Can click (zVIEW) or zoom (z/VM) to see the all of
the users in a class.
Processor use CPU% Total/Virtual/T:V Rat - This shows again how much CPU time the class/user is using.
The highest user percentage is easily seen by class and by user (if classes are set up). For a Linux guest, a T:V ratio
over 1.0 is high. This means the guest is doing more CP functions (such as spin locks) than expected in their workload.
ESALNXP can also be used if this is a Linux user to see which processes
are being run. Virtual time should be equal or close to the total CPU percent or there may be overhead issues.
% of LPAR CPU - This shows the percentage of total CPU and storage allocated to the LPAR for this
user/class.
ESAUSP5 - Shows user SMT CPU percent utilization by user. See
SMT Analysis for more
information about performance with SMT active.
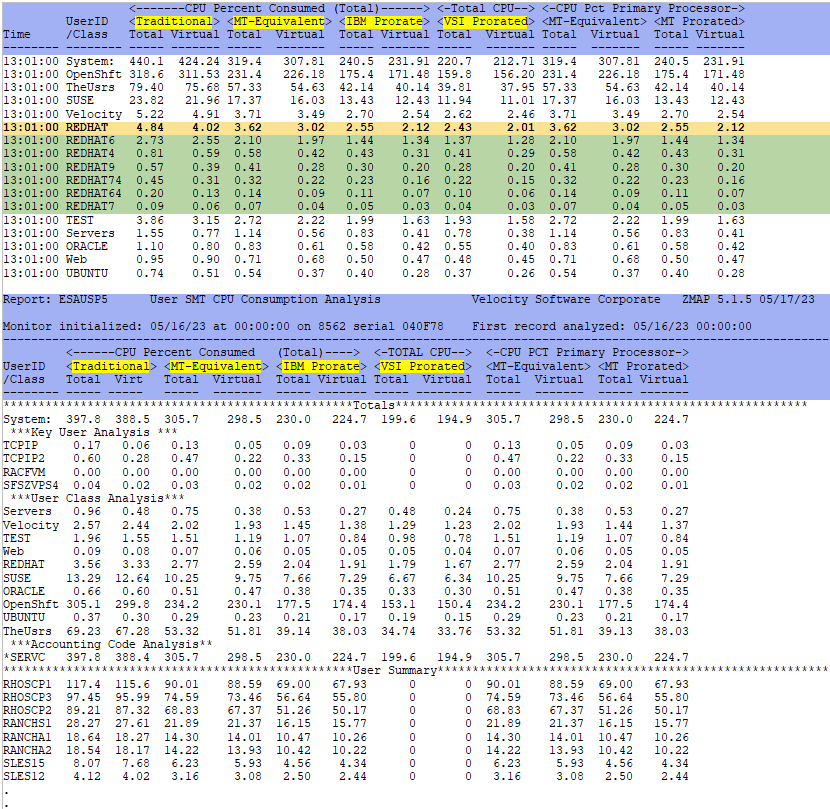
CPU Percent Consumed Traditional Total/Virtual - This shows the time the CPU core was assigned and dispatched
on a thread.
CPU Percent Consumed MT-Equivalent Total/Virtual - This shows the time if SMT was not enabled. This also
shows the cost in response time.
CPU Percent Consumed IBM Prorated Total/Virtual - This shows (approximately) the cycles that were really used.
Total CPU VSI Prorated Total/Virtual - This shows the total prorated CPU busy percent as computed
by Velocity.
ESAXACT - Shows transaction delay analysis.
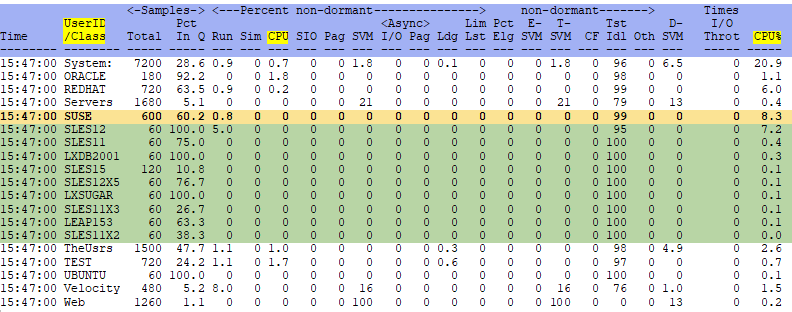
UserID/Class - This shows the machine user or user class. Can click on a line (zVIEW) or zoom (z/VM) to see
the all the users in the group.
Percent non-dormant CPU - This shows the percentage of time a user/server/class is waiting for CPU.
The virtual machine (virtual processor) is ready and waiting to be dispatched to run but there
is no physical processor currently available. A number over 20 is excessive.
If a machine has a high CPU wait, check the ESAUSR2 report to compare its CPU use to the total CPU use.
Check the CPU utilization for the system, the relative SHARE of the id and
also check LPAR weights/overhead (See LPAR weights/overhead)
CPU% - This is the CPU percentage used by the class or user.
ESAUSRD - Shows virtual machine diagnose command count
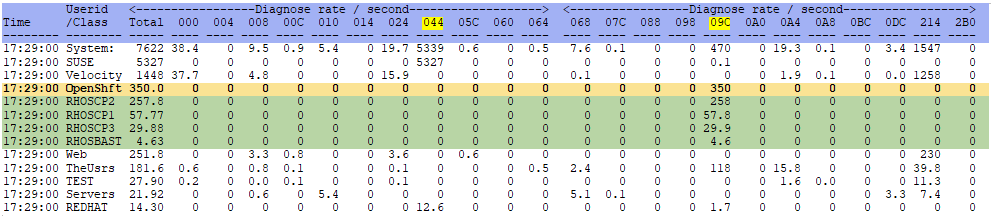
UserID/Class - This shows the machine user or user class. Can click on a line (zVIEW) or zoom (z/VM) to see
the all the users in the group.
Diagnose 044/09C - This shows the diagnose rate for users/classes. These two diagnose commands are indicative
of spin locks. Diag 044 are more costly than 09C.
Look at how many vCPUs are allocated to machines that have high 044/09C rates (over 100k)
- too many vCPUs can cause excessive spin locks and are inefficient.
ESATOPU - This shows the top user consuming the most CPU for each minute.
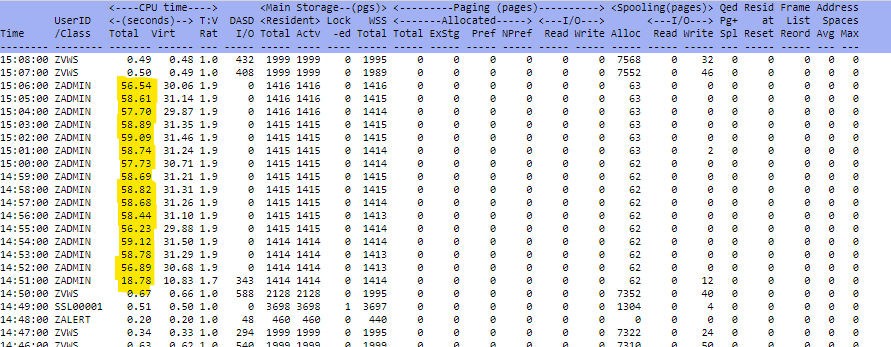
Userid/Class - This shows for each minute the top consuming user. If this is a spike, as this picture shows,
find out what happened and why this user/server is suddenly consuming so much of the system.
In this case, it was a system programmer running a trace.
Total CPU time - This shows how much of the system is being utilized. It is easy to see the spike in
this picture.
DASD I/O - This shows the DASD I/O in an interval. If the number shows as 0 and there is high CPU utilization,
the user may be "looping" and should be checked/logged off.
ESAUSER - This allows for user-specific information to be shown for a particular user.
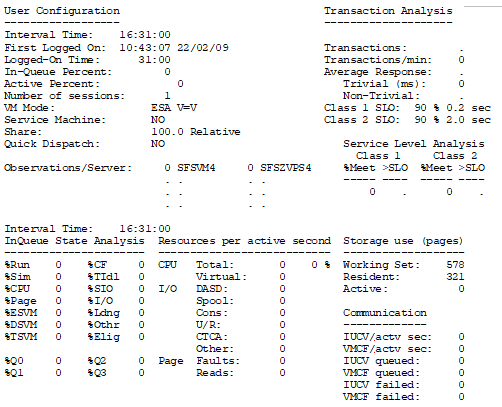
Each line has information about a particular user. This is a quick way to see the data from the above screens in one
place for one user.
Back to top of page
Back to Flow Chart main page

