User Analysis
User Analysis
Often it is just one user/server that is somehow misbehaving that can cause the system massive amounts of grief.
The following page shows user information pertaining to CPU utilization, memory, wait states, share settings and
more to determine if there is a user/server (or sometimes a class) that is the focal point of a system problem.
ESAUSP2 and ESAXACT are especially good for creating alerts from or putting highlights on to see at a glance any high
user utilization. Reports ending in 'R' are raw data and the reports ending in 'P' are percentages.
Helpful ESAMON screens/ESAMAP reports (further explained below):
- ESAUSP2 - User Percent Utilization - shows virtual machine percent utilization of processor/memory/page/spool.
- ESAUSP5 - User SMT CPU Percent Utilization - shows CPU utilization in an SMT environment.
- ESAXACT - Transaction Delay Analysis - shows virtual machine wait states.
- ESAUSRC - User Configuration - shows the machine configuration for all users.
- ESAUSPG - User Storage Analysis - shows user memory information.
- ESAUSRD - Virtual Machine Diagnose Analysis - shows by user/class what diagnose commands are being done.
- ESATOPU - Top Users Resource Use - shows by minute the number one top user of resources.
- ESATUSRS - Top Users Resource Use - shows each minute all of the users, sorted by top user of CPU.
- ESAUSRS - Display Users - shows an assortment of information about the users.
- ESAHDR (zMAP report) - System Configuration - shows the top ten users for each day.
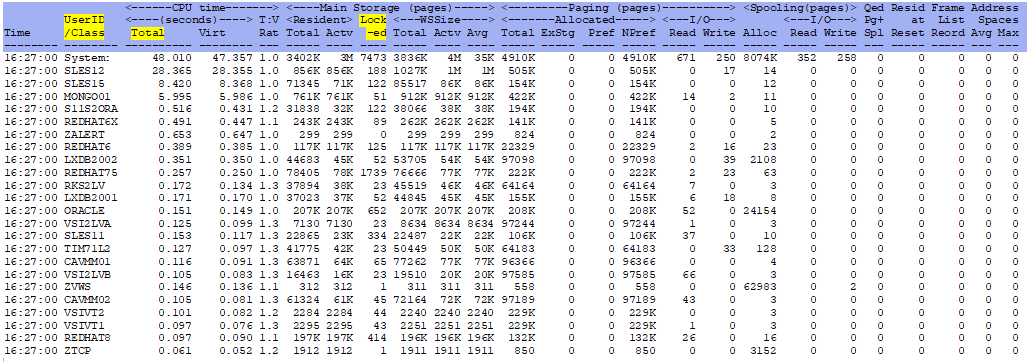
ESAUSP2 - Shows user percentage utilization - both screen and report information is shown
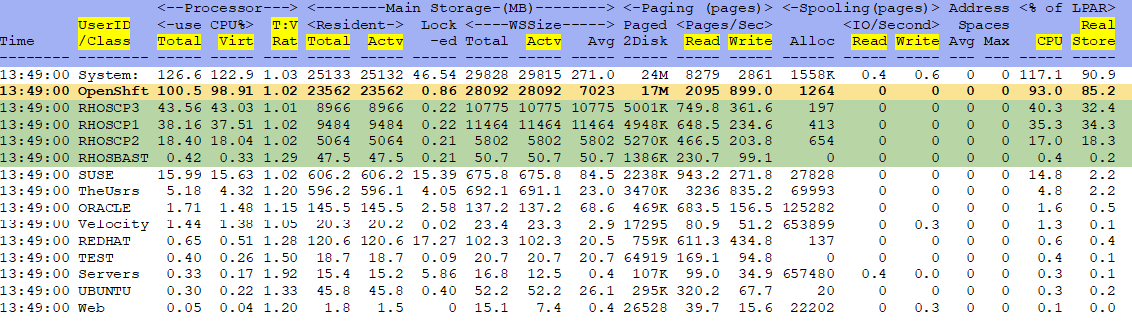
UserID/Class - This shows the classes and/or UserID's. Can click (zVIEW) or zoom (z/VM) to see the all of
the users in a class.
Processor use CPU% Total/Virtual/T:V Rat - This shows again how much CPU time the class/user is using.
The highest user percentage is easily seen.
ESALNXP can also be used if this is a Linux user to see which processes
are being run. Virtual time should be equal or close to the total CPU percent or there may be overhead issues.
Main Storage Resident Total/Activ - This shows again how much memory the class/user is using.
Main Storage WSSize Actv - This shows the active working set size of the class/user. This can affect the
system memory when multiple large users/servers logon at the same time but is not really relevant for servers once
logged on.
Paging Read/Write - This shows again how much paging the class/user is doing. Watch for spikes which could
indicate high page/in, page/out which will cause response time issues. The servers may be configured incorrectly
or there isn't enough memory to run the workload.
Spooling Read/Write - This shows again how much spooling the class/user is doing. Watch for spikes which
could indicate a user that is spewing spool files or is building a huge spool file.
% of LPAR CPU/Real Store - This shows the percentage of total CPU and memory allocated to the LPAR for this
user/class. It is often easy to see who is using the most resources.
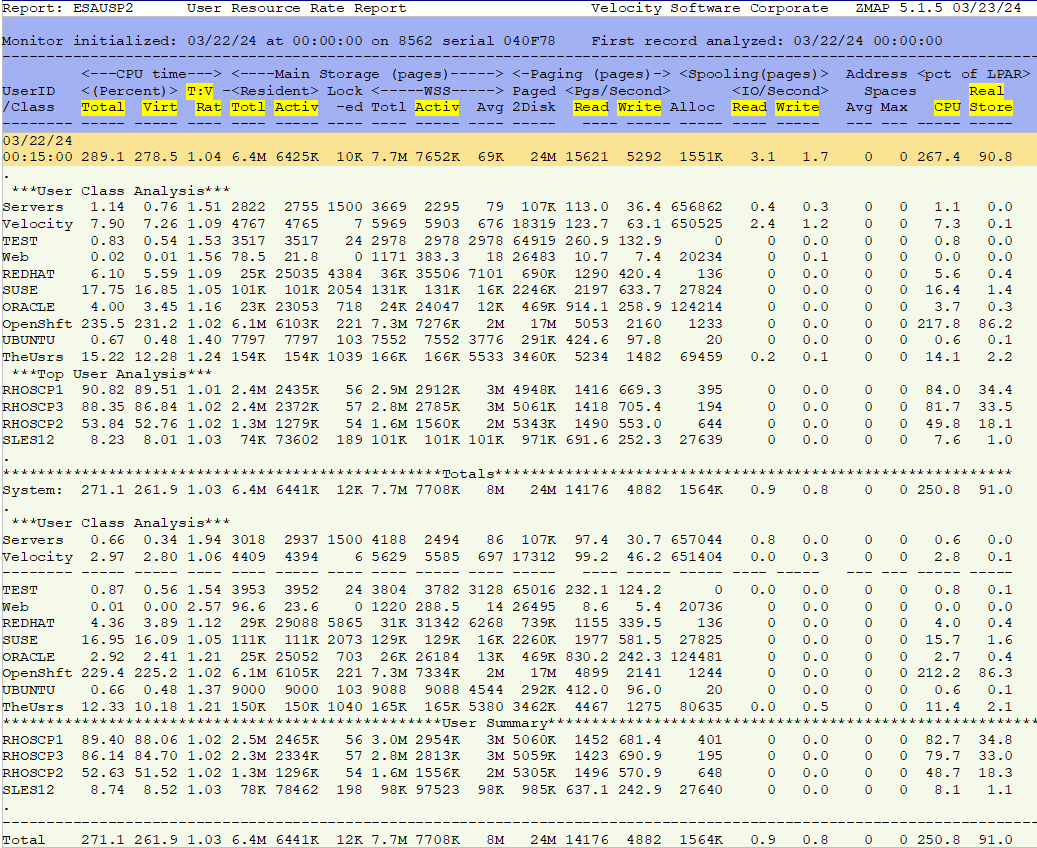
Note: The report will show totals for each 15 minute increment during the day and the day's totals.
This is great for trending and problem research. If seeing the top
users jump in Total CPU over the course of a few minutes, especially if
it happens daily at the same time, there may be a Linux CRON job or equivalent
timed process happening. Check the ESALNXP report for process names/CPU usage (process names are truncated to 15
characters).
ESAUSP5 screen/report - Shows user SMT CPU percent utilization by user. See
SMT Analysis
for more information about performance with SMT active.
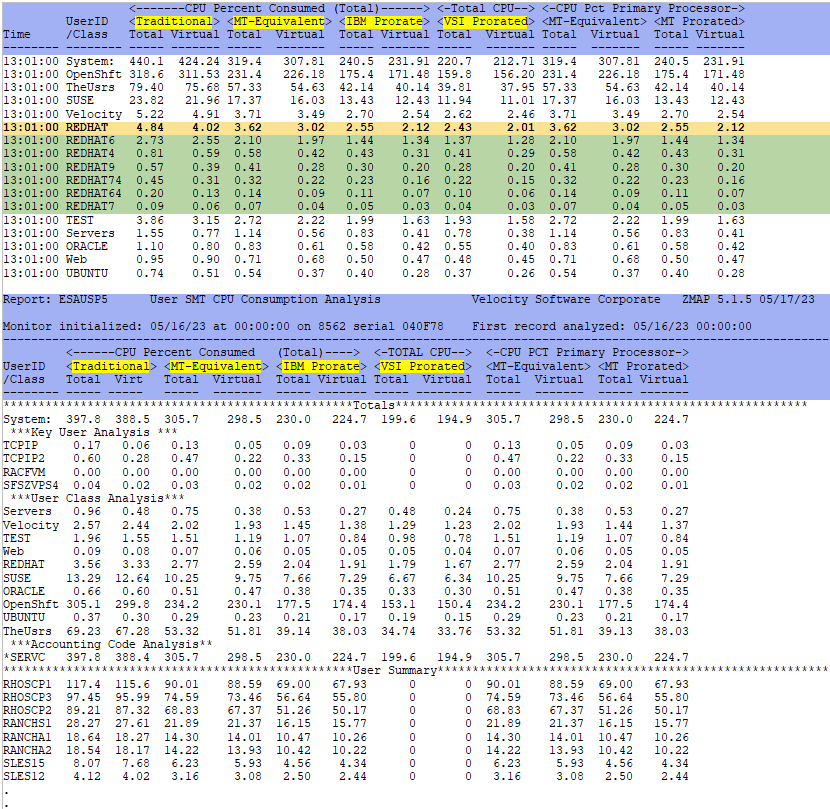
CPU Percent Consumed Traditional Total/Virtual - This shows the time the CPU core was assigned and dispatched
on a thread.
CPU Percent Consumed MT-Equivalent Total/Virtual - This shows the time if SMT was not enabled. This also
shows the cost in response time.
CPU Percent Consumed IBM Prorated Total/Virtual - This shows (approximately) the cycles that were really used.
Total CPU VSI Prorated Total/Virtual - This shows the total prorated CPU busy percent as computed
by Velocity.
Note: ESAUSP5 is all about CPU utilization with SMT. It is great for capacity planning and chargeback. See
the SMT Analysis link above.
ESAXACT screen/report - Transaction Delay Analysis - This shows an analysis of virtual machine states and
wait states.
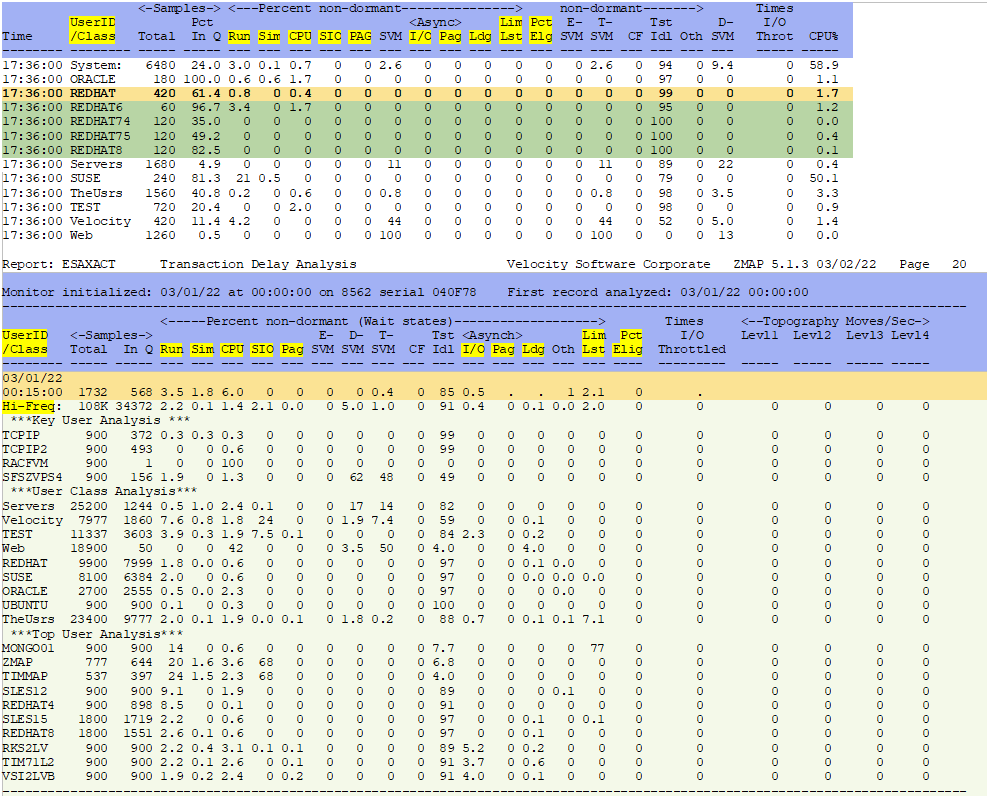
UserID/Class - This shows the system total and totals for servers/classes. For the screen - Can click (zVIEW)
or zoom/PF2 (z/VM) to see each user/server in a class.
Percent non-dormant Run - The percentage of virtual machines in Running state are actually dispatched and doing
work. This will number will go down as response times go up.
Percent non-dormant SIM - This shows the percentage of time a user/server/class is waiting for the z/VM control
program to execute (or simulate) instructions on its behalf.
This state is a function of master processor utilization and contention. The master
processor is a single threaded resource as certain functions can only run on the master processor,
such as spool, diagnose and IUCV functions. Users performing a significant amount
of these functions have high simulation wait. A number over 10 is excessive.
Percent non-dormant CPU - This shows the percentage of time a user/server/class is waiting for CPU.
The virtual machine (virtual processor) is ready and waiting to be dispatched to run but there
is no physical processor currently available. A number over 20 is excessive.
If a machine has a high CPU wait, check the ESAUSR2 report to compare its CPU use to the total CPU use.
Check the CPU utilization for the system, the relative SHARE of the id and
also check LPAR weights/overhead.* See LPAR weights/overhead
Percent non-dormant SIO - This shows the percentage of time a user/class is waiting for I/O.
This is a measure of the effectiveness of I/O tuning such as the use of minidisk caching, or DASD cache.
Check the DASD and cache utilization for the system. There may be a device problem or
a cache issue.
Percent non-dormant PAG - This shows the percentage of time a user/class is waiting on needed pages that are
no longer in memory and must be read in from DASD. A number over 10 is excessive.
Check the memory/paging utilization for the system. Also reserving memory for an id in this situation
(such as - SET RESERVED id 1000) will also help.
Percent non-dormant Async I/O - This shows the percentage of time a server (multiprocessing system) is
waiting for asynchronous I/O. This state is entered when there is an outstanding I/O
and the user has loaded a wait state PSW. It occurs for guests running an
operating system such as Linux, VSE, z/OS or second-level z/VM.
Percent non-dormant Async Pag - This shows the percentage of time a server (multiprocessing system) is
waiting on paging. If a server is in this state, they are waiting for a page to be read by the system.
Check the memory/paging/DASD utilization for the system.
Percent non-dormant Ldg - This shows the percentage of time a user/server/class is 'loading' if it has a
high count of page reads or if its pages were paged out. This can indicate a thrashing condition.
This is where the system is struggling to get memory resources to run machines.
Check the memory/paging/DASD utilization for the system.
Percent non-dormant Lim Lst - This shows the percentage of time a user/server/class is on the "Limit List".
This could be due to SHARE LIMIT being set or possibly a resource pool constraint.
Check SHARE size for the id, CPU utilization and/or resource pool utilization.
Percent non-dormant Pct Elig - This shows the percentage of time a user/server/class is on the eligible list
waiting to enter the dispatch list. If this number is not zero, it is not good.
The guests are waiting on some resource - check the other columns to find the
bottleneck.
ESAUSRC - Shows user resource utilization
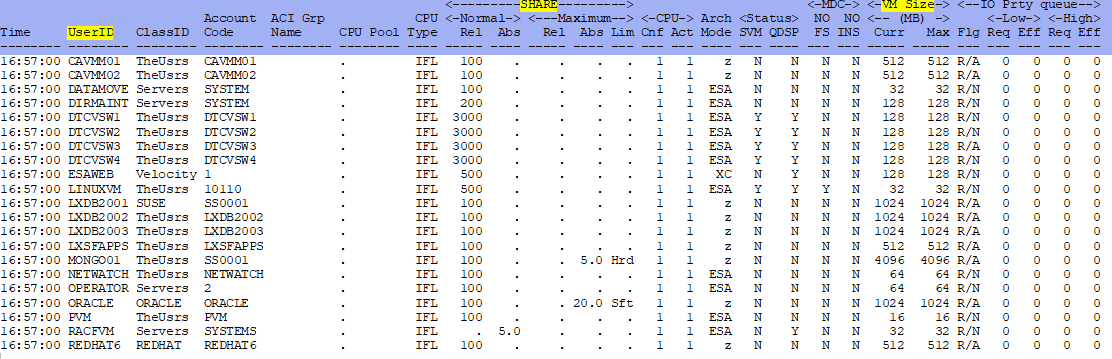
UserID/Class - This shows the UserID of the virtual machine.
SHARE normal/maximum, relative/absolute/limits - This shows the SHARE settings for a virtual machine.
Verify that the correct machines have the correct SHARE settings/limits. Remember
if a machine has more than one CPU, the SHARE is split equally between each.
Note: See Setting SHARE Values for Virtual Machines for more information about setting
SHARE values.
ESAUSPG - Shows user memory information. Both screen and report samples:
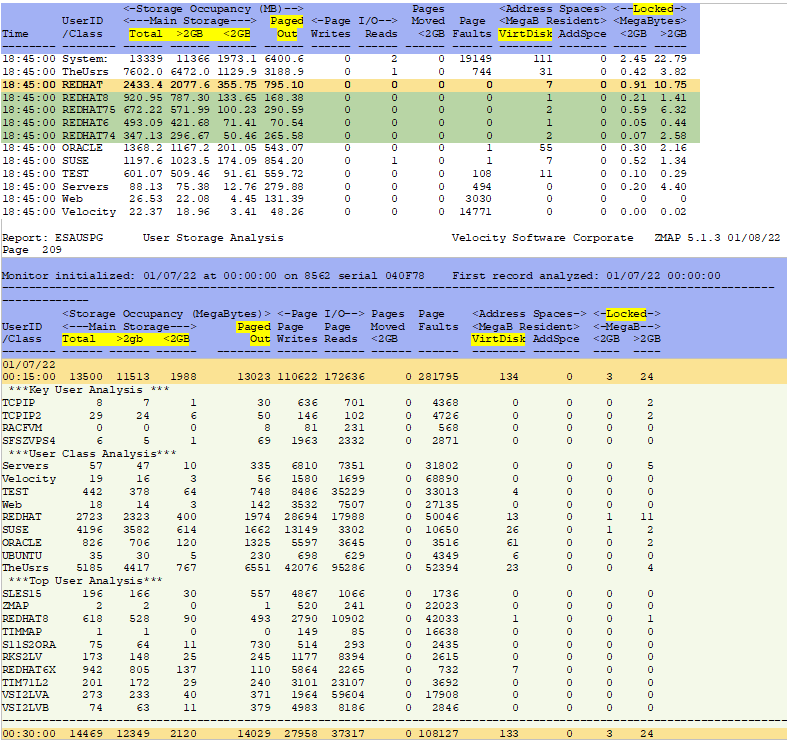
Total >2GB <2GB - This shows total memory above and below the 2GB line by group, then by members of
the group. It can be helpful to see memory by user class.
Watch for spikes in total memory and downward trend for <2GB storage (memory)
Paged out - This shows the amount of memory that is paged out, which means the data had to be written
out to disk. Look for large fluctuations in these numbers.
VirtDisk - This is memory resident in virtual disk address spaces. Look for spikes.
The top user analysis on the report can help with time of problem determination
and trending.
Locked MegaBytes - This shows locked memory in MB both above and below 2GB. If the combined number is over
4000, there are too many pages locked. Use reserved pages instead.
ESAUSRD - Shows virtual machine diagnose command count
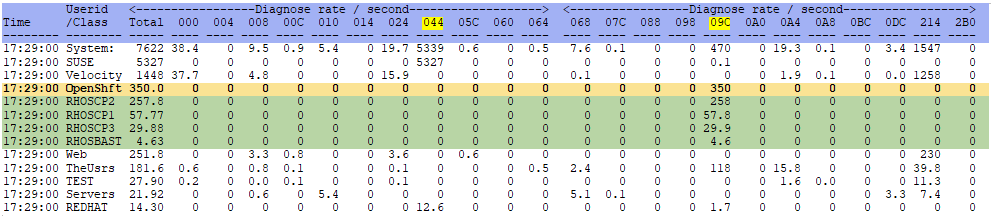
UserID/Class - This shows the machine user or user class. Can click on a line (zVIEW) or zoom (z/VM) to see
the all the users in the group.
Diagnose 044/09C - This shows the diagnose rate for users/classes. These two diagnose commands are indicative
of spin locks. Diag 044 are more costly than 09C.
Look at how many vCPUs are allocated to machines that have high 044/09C rates - too many
vCPUs can cause excessive spin locks and are inefficient.
ESATOPU - This shows the top user consuming the most CPU for each minute
Userid/Class - This shows for each minute the top consuming user. If this is a spike, as this picture shows,
find out what happened and why this user/server is suddenly consuming so much of the system.
In this case, it was a system programmer running a trace.
Total CPU time - This shows how much of the system is being utilized. It is easy to see the spike in
this picture.
DASD I/O - This shows the DASD I/O in an interval. If the number shows as 0 and there is high CPU utilization,
the user may be "looping" and should be checked/logged off.
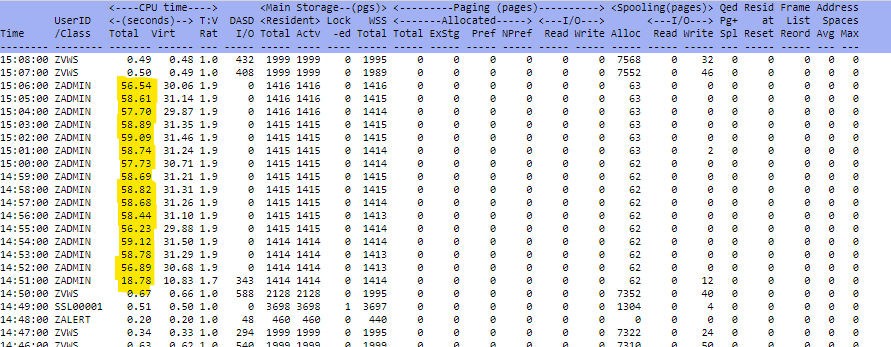
ESATUSRS - This shows the top users consuming the most CPU for each minute
Userid/Class - This shows for each minute the top consuming users. This is helpful to show if there is one
user/server consuming much of the system.
It could also be there are many users/servers with high utilization which could
indicate a busy time of day, etc.
Total CPU time - This shows how much of the system is being utilized by each user/server and the total system
utilization. The SLES15 system above may or may not be a 'problem'.
In this case, it is normal for this system to be higher than the rest. If a userid
is running over 50%, it could be looping or may need to set a limit on its SHARE (SET SHARE xxx ... LIMITSOFT).
Main Storage Locked - This shows locked memory. If the number is over 4000, there are too many pages locked.
Use reserved pages instead.
Note: In either zVIEW or 3270, these columns can be sorted. So at a glance (or with sorting) can see which
users are consuming the most resources.
ESAUSRS - This shows an assortment of information about the users
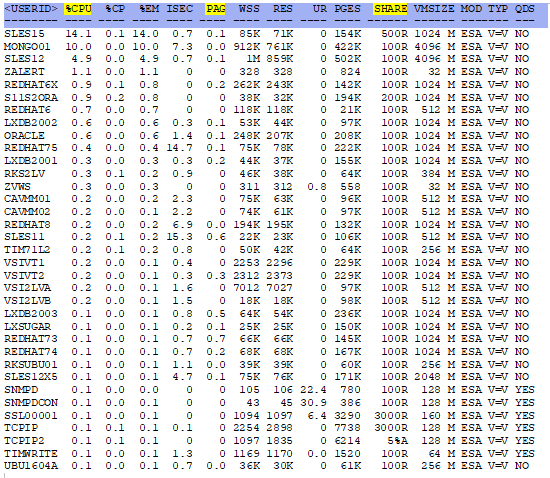
USERID - This shows a summary of information for each user.
%CPU - This is the CPU utilization for each user - sorted to put top CPU users on top.
PAG - This shows the paging rate for each user. If this number is above 10 for a user, they are experiencing
paging delays.
Investigate reserving paging for the user or if there are other paging issues.
ESAHDR (zMAP report) - Look for Top users and user classes by CPU consumption
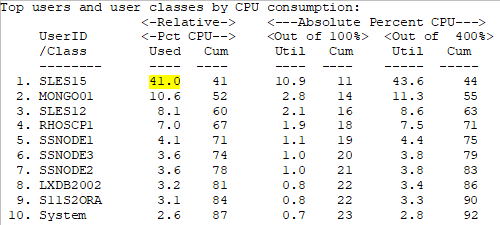
Userid/Class - This shows the top ten users for a day. This is helpful for trending and to help determine
when a problem may have started. EASUSR2 zMAP report will break this down by 15 minute intervals,
however it can be helpful to know what day the problem started if has been happening
for a few days.
Total CPU time - This shows how much of the system is being utilized by the top ten users for the day.
Conclusions:
If there are users/servers that are consuming a large portion of the system, it may be the workload or it may be some
issue with that user/server. Follow the User Problem flow to chase it down. It may also be a time of day issue. If users
are grouped by class, it may be that setting up resource pools to give certain groups (like test) less resources during
the day or other groups (like batch) more resources at night would be helpful. See
Resource Pool/CPU pool for more information.
Back to top of page
Back to Flow Chart main page

